



How to Build a 2027 Talent Acquisition Budget From the Hiring Plan Up, With a Real Price for Every Line
The average non-executive hire cost US employers $5,475 in SHRM's latest benchmarking, but the median hire cost just $1,200. Both numbers come from the same survey of 2,371 organizations: SHRM reported the averages in its press release - SHRM and the medians in its data brief - SHRM 2025 Recruiting Benchmarking. For executive hires, the average was $35,879 against a median of $10,625. The gap between those figures is the single most useful fact in recruiting budget planning: most hires are cheap, and a small number of expensive ones (an agency placement, a relocation, an executive search, a visa) decide what the whole year costs.
But here is the problem: most recruiting budgets are still built top-down. Finance takes last year's number, adds or cuts a few percent, and hands talent acquisition a total before anyone has turned the 2027 headcount plan into a list of hires. The budget then breaks in March, when the first unplanned backfills arrive, or in September, when an agency invoice for a hard-to-fill role eats the job advertising money. Meanwhile, the inputs have changed under everyone's feet. Recruiters now handle 93% more applications than in 2021 with teams 14% smaller - Gem. AI sourcing tools, AI screening and recruiting agents have turned what used to be a headcount question into a software question.
This guide gives you a line-by-line template with 22 budget lines grouped into five blocks: people, technology, attraction, per-hire costs, and risk. For every line it explains what belongs in it, the formula that drives it, and a real 2026 price or benchmark you can plug in, from published vendor prices and negotiated-contract medians to agency terms of business and government fee schedules. It then works through a complete 2027 budget for a 400-person company making 100 hires, shows how the total moves under three scenarios, and covers how AI agents are reshaping each line. Every figure links to its source, and where a number is an assumption or our own arithmetic, the text says so.
Written by Yuma Heymans (@yumahey), founder of HeroHunt.ai. Before building AI recruiting software he worked as a management consultant at Bain and KPMG, and this template applies the driver-based planning consultants use to the recruiting budget. He now sees recruiting budgets from the vendor side, which is why every tool price below is quoted from a published page or a contract database rather than a sales deck.
Contents
- The 2027 Recruiting Budget at a Glance
- Step One: Turn the Headcount Plan Into a Hiring Plan
- How Much Should Recruiting Cost? Benchmarks That Hold Up
- Lines 1-5: The People Budget
- Lines 6-10: The Technology Budget
- Lines 11-14: The Attraction Budget
- Lines 15-20: The Per-Hire Budget
- Lines 21-22: Compliance, Fraud and the Reserve
- The Complete Template: A Worked 2027 Budget
- How AI Agents Are Changing the 2027 Budget
- How Recruiting Budgets Fail, and How to Defend Yours
- The Bottom Line: A Decision Framework
1. The 2027 Recruiting Budget at a Glance
A defensible 2027 recruiting budget is a hiring plan multiplied by a cost model, not a percentage of last year's spend. You start with how many people you need to hire, split them by how hard they are to find, decide which channel fills each group (your own team, job ads, referrals, an agency, an AI tool), and only then price the lines. Done in that order, the budget explains itself: if the CFO cuts it by 20%, you can show exactly which hires disappear or which roles move to a slower channel. Done the other way round, the budget is a number with no handle, and the first surprise breaks it.
The shape of the answer is fairly stable across companies. For an organization with an in-house talent team, people costs (recruiters, coordinators, the talent leader) are usually the largest fixed block, and agency fees are usually the largest variable block whenever they are used at all. Technology is smaller than vendors' marketing suggests, though it is where many talent teams plan to invest, and advertising, referral bonuses and per-hire extras such as background checks fill in the rest. In the worked example later in this guide, people take roughly half the cash budget and a handful of agency placements take about a fifth, while all the software together comes to under a tenth.
The five blocks and 22 lines
The template groups every recruiting cost into five blocks, because each block behaves differently when the hiring plan changes. People costs are mostly fixed for the year and scale in steps (you cannot hire half a recruiter, although you can rent one). Technology is mostly fixed and seat-based, signed annually, and hard to cut mid-year. Attraction costs such as job ads scale smoothly with the number of open roles. Per-hire costs such as agency fees, background checks and relocation are triggered only when someone is actually hired. Risk covers the lines most budgets forget: compliance work, candidate verification and a reserve for the plan changing.
Separating fixed from variable lines is what lets you reforecast honestly. If the 2027 plan drops from 100 hires to 70, variable lines fall almost automatically, while fixed lines only fall if you act (cancel seats, end a contract recruiter, delay a hire). The table below is the full template. The rest of this guide walks through each line in order, with the formula and a sourced price.
| # | Line | Driver formula | 2026 reference price (sourced below) |
|---|---|---|---|
| 1 | Talent leadership | Head of talent salary x loaded-cost factor | $149,280 BLS median, HR managers |
| 2 | Recruiters and sourcers | Hires / hires per recruiter x loaded salary | 29 hires per recruiter a year (Gem) |
| 3 | Coordinators and ops | 1 per 3-4 recruiters x loaded salary | $52,250 BLS mean, HR assistants |
| 4 | Flex capacity | Peak months x contract rate, or RPO fee | Contract or per-hire RPO pricing |
| 5 | Hiring-team time | Interview hours per hire x loaded hourly cost | 12-26 interviewer hours per hire (Gem) |
| 6 | Applicant tracking system | Annual contract | $15,400-$26,570 Vendr medians (Lever to Greenhouse) |
| 7 | LinkedIn Recruiter seats | Seats x seat price | £8,575 per seat (3-10 seats, UK list) |
| 8 | AI sourcing and outreach | Seats or usage x price | $99-$494 per seat a month (list) |
| 9 | Contact data | Seats x price, if not bundled | $49 per seat a month (Apollo Basic) |
| 10 | Assessments and interview tools | Platform fee or per-candidate | $13,533 Vendr median (HackerRank) |
| 11 | Job advertising | Ad-sourced hires x cost per hire | $1,340 median cost per hire (Appcast) |
| 12 | Employer brand and careers site | Annual fees and content | £12,100 LinkedIn Career Page (Basic, UK list) |
| 13 | Events and campus | Events x cost | Your own plan |
| 14 | Referral bonuses | Referral hires x bonus | $1,936 average bonus (AAIMEA) |
| 15 | Agency and search fees | Agency hires x salary x fee % | 20-30% contingency, one-third retained |
| 16 | Background checks | Checks x price | $29.99-$94.99 per report (Checkr) |
| 17 | Candidate travel | Onsite candidates x trip cost | $428 average airfare + $181 a day |
| 18 | Relocation | Relocations x package | $10,000-$12,499 most common lump sum |
| 19 | Immigration and EOR | Petitions x fees; EOR months x fee | $2,965 premium processing; $599 a month EOR (Deel list) |
| 20 | Sign-on bonuses | Hires with bonus x amount | Decide which budget owns it |
| 21 | Compliance and verification | Audits, legal review, ID checks | Quote-based |
| 22 | Contingency reserve | % of variable lines | 10% of variable lines (this guide's default) |
Read the table as a checklist rather than a shopping list. Most companies will set several lines to zero: a 60-person startup may have no coordinator, no relocation and no immigration line, while a hospital system may spend nothing on LinkedIn Recruiter and a great deal on job advertising and sign-on bonuses. The point of keeping all 22 lines visible is that a line you consciously set to zero is a decision, while a line you never listed is a surprise waiting to happen. The reference prices are the starting points the rest of this guide explains and sources, including where each one is misleading.
How the pieces fit together
The order of operations matters more than any single number, so it is worth seeing the whole flow before going line by line. The diagram below shows how the template is built: the headcount plan produces a hiring plan, the hiring plan is split by role difficulty and channel, capacity math sizes the team, and only then are the lines priced and stress-tested with scenarios.
The diagram makes one dependency explicit: channel choice sits upstream of almost every cost. Deciding that five hard technical roles will go to a contingency agency rather than to your own recruiters with better sourcing tools moves well over $100,000 between lines before a single job is posted. That is why the template asks you to assign a channel to each group of roles before pricing anything, and why the scenario step at the end is not optional. The next section starts at the top of the diagram, with the hiring plan itself.
2. Step One: Turn the Headcount Plan Into a Hiring Plan
The number of people you need to hire in 2027 is not the number of new roles in the headcount plan. It is growth hires plus backfills for the people who will leave, minus the roles you fill by moving existing employees. For many companies backfills are as large as growth, and in a flat year they are the entire plan. Leaving them out is how a recruiting budget runs out by the third quarter: finance approved "40 new roles" while talent acquisition actually needed to make 85 hires.
The arithmetic is simple, and it is worth writing down so everyone agrees on the inputs. External hires equal net headcount growth, plus expected departures multiplied by the share of those roles you will refill, minus the openings you expect to fill internally. Each input deserves a source. Growth comes from the operating plan. Departures come from your own trailing 12-month attrition, by department if you have it. The refill rate is a management decision, and in 2027 it is increasingly a question of whether AI tools absorb some of the work of people who leave. Internal fills come from your own history: SHRM's 2025 data shows a median of 93% of non-executive roles filled externally overall, and about 90% at medium-sized organizations - SHRM 2025 Recruiting Benchmarking.
Backfills: use your own attrition, then sanity-check it
Your own turnover data is always better than a national average, but the national data tells you whether your assumption is plausible for your industry. The US Bureau of Labor Statistics measures hires, quits and layoffs every month in its Job Openings and Labor Turnover Survey. Adding up the 2025 monthly rates gives an approximate annual picture: across all nonfarm employers, hires ran at about 40% of employment and quits at about 24%, but the spread across industries is enormous - BLS JOLTS. By the same arithmetic, quits ran at about 15.5% in the information sector, 16% in financial activities and 28% in professional and business services, against about 47% in leisure and hospitality.
The trend matters as much as the level, because many companies still carry attrition assumptions from 2021 and 2022. The chart below shows the annualized rates (the sum of each year's seasonally adjusted monthly rates, our arithmetic from BLS data) for all nonfarm employers, with 2026 annualized from January to August.
US Hires, Quits and Layoffs Rates, Annualized
The chart shows a labor market that economists describe as low-hire, low-fire. Quits have fallen from about 33% of employment in 2022 to about 23% on the 2026 run rate, below even 2019, and the latest monthly reading for August 2026 was a quits rate of 1.9% with a hires rate of 3.3% - BLS JOLTS news release. For budgeting, that has two consequences. Backfill volume is lower than it was when many attrition assumptions were set, so an old assumption overstates hiring. And the people who do quit are disproportionately the ones with options, which means backfills skew toward harder, more expensive roles.
Growth: plan for a measured market, not a rebound
Employer surveys point to modest, positive hiring heading into 2027 rather than a return to 2021. ManpowerGroup's survey of 39,878 employers, collected in July 2026, put the US net employment outlook for the fourth quarter of 2026 at 36% (the share of employers planning to add staff minus the share planning cuts), against a global figure of 29% - ManpowerGroup Employment Outlook Survey Q4 2026. Gem's dataset of 1.2 million hires shows aggregate hiring up 8.3% year over year but still about 30% below the 2021 peak, with smaller and growth-stage companies leading the recovery and enterprises moving cautiously.
The chart below, from Gem's 2026 Recruiting Benchmarks Report, shows hiring volume relative to the June 2021 to May 2022 baseline across its customer base. The dip and partial recovery are what most talent leaders lived through.
Hiring volume is recovering, but remains well below 2021
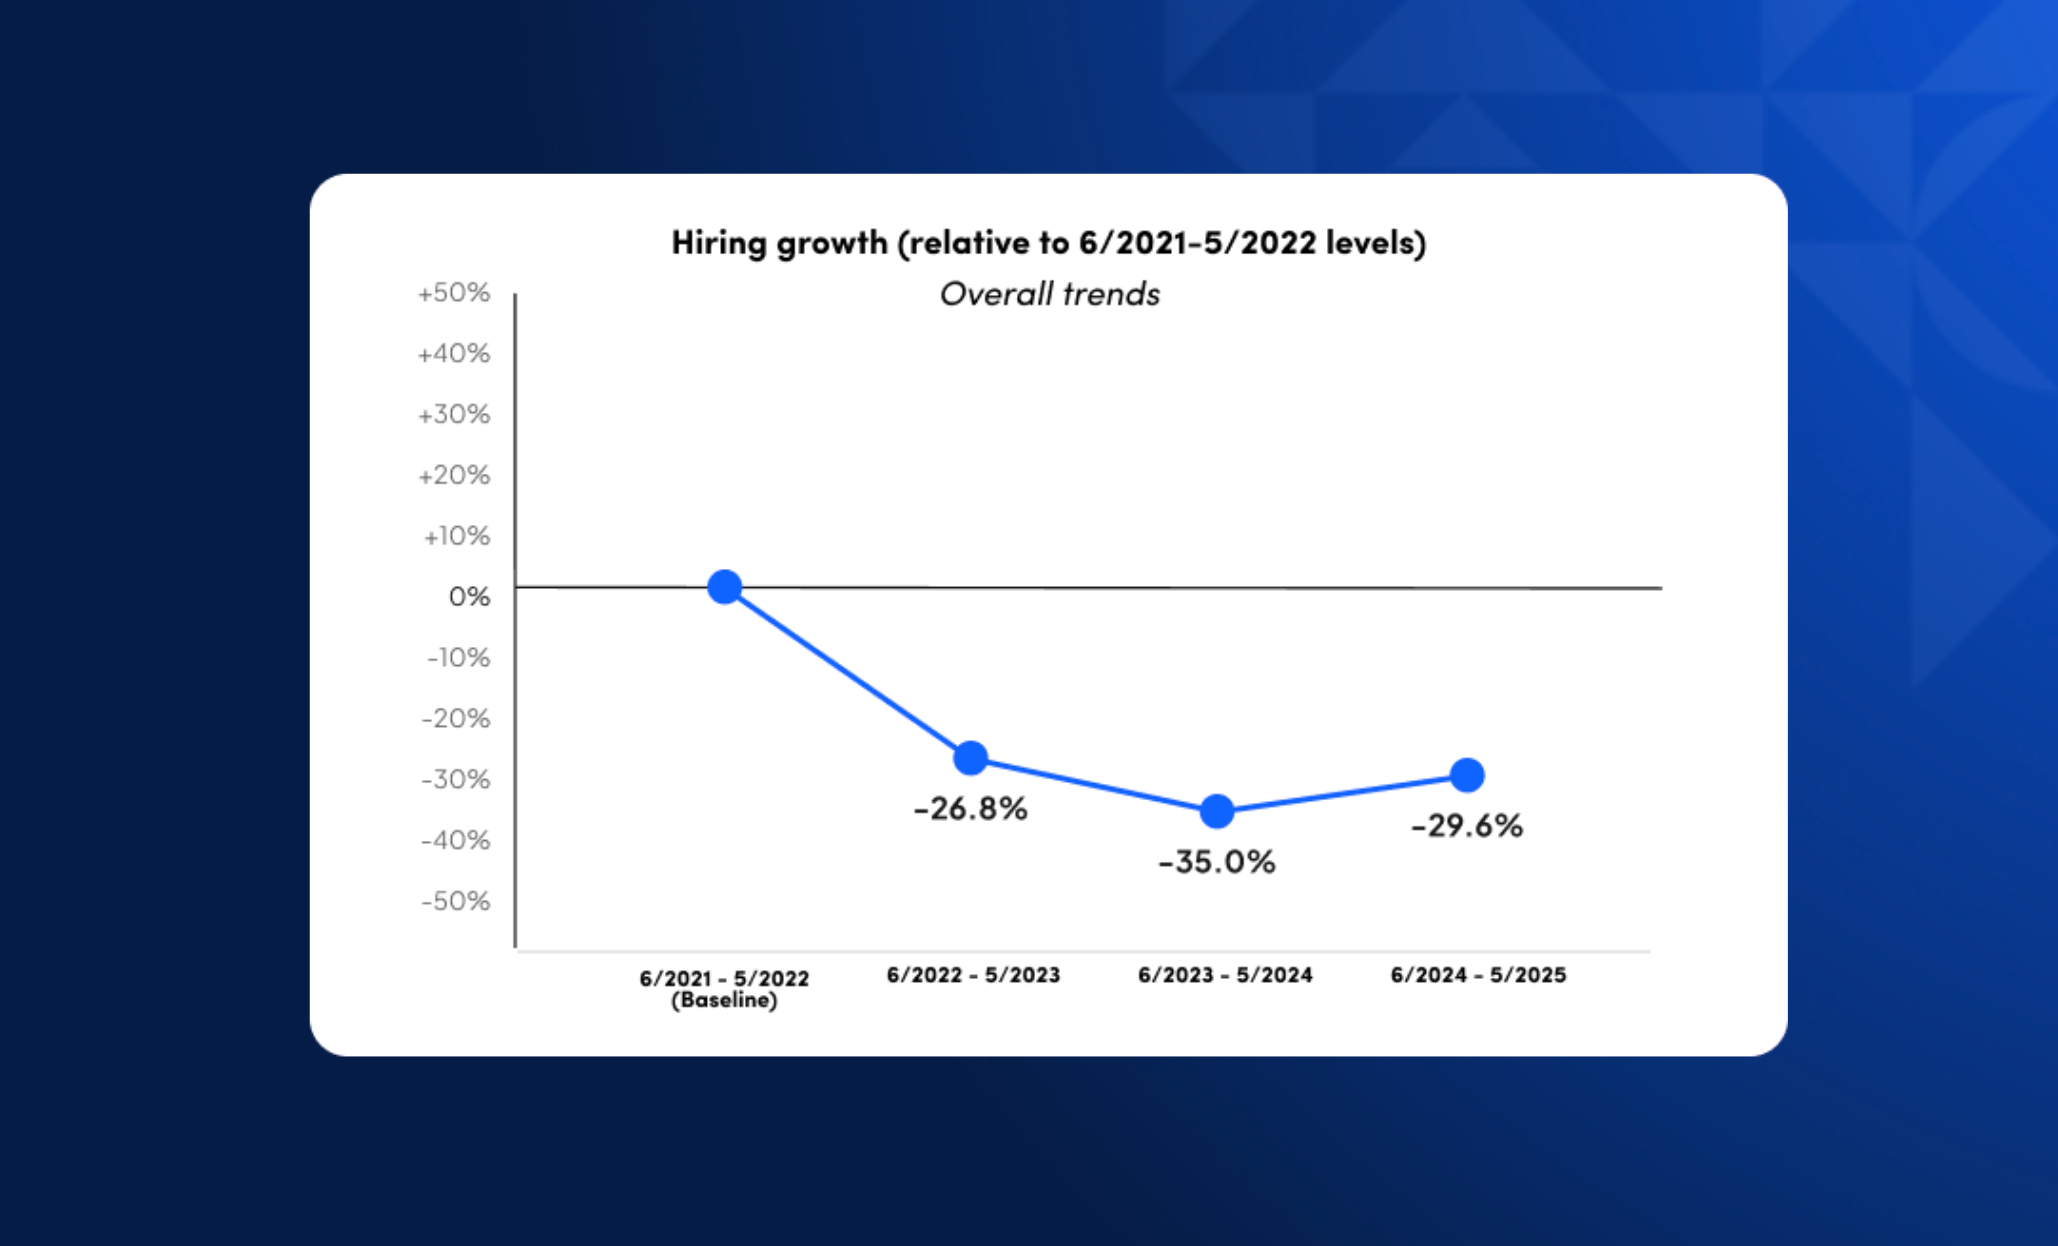
The line bottoms at 35% below baseline in the June 2023 to May 2024 period and recovers to 29.6% below in the most recent year. Two planning lessons follow. First, if your 2027 plan assumes a sharp rebound in hiring, it is betting against the data, so tie growth hires to specific, funded roles rather than a percentage. Second, compensation budgets are tight too: Marsh Mercer's survey of 1,001 US organizations found 2027 merit budgets of 3.2% and total salary increase budgets of 3.5%, with its lead researcher noting that "compensation dollars are tight" - Marsh Mercer. A recruiting budget that asks for much more than that is competing with pay rises for the same money.
Split the plan by role difficulty
Once you know the total number of hires, split it into a few groups that cost very different amounts to fill. Averages hide this. A support representative hired from job ads and an AI engineer found through outbound sourcing are both "one hire", but they differ by an order of magnitude in recruiter time, advertising cost, interview hours and the probability of an agency fee. Four groups are enough for most companies, and each needs its own default channel before any line can be priced.
Define the groups by how candidates are found and how long the roles take to fill, not by department. A senior accountant and a senior engineer can both be hard roles if the market for each is thin, while an entry-level engineering role at a well-known company may behave like a volume role because applicants arrive unprompted. Use your own time-to-fill and source-of-hire data from the last two years to place each role family, and where data is missing, ask recruiters which roles they expect to need outbound sourcing. The result is a short table of hires by group that every later line refers back to.
- Volume roles: hourly, support, early-career and other roles with many qualified applicants
- Standard professional roles: sales, marketing, finance, operations and similar
- Hard roles: specialized technical, clinical or senior individual contributors
- Leadership and executive roles: director level and above
The split drives almost every line that follows. Volume roles consume advertising budget and coordinator time but little sourcing. Hard roles consume sourcing tools, interviewer hours and, too often, agency fees. Executive roles are few but expensive: SHRM's median executive cost per hire is roughly nine times the non-executive median. Ashby's data shows why the groups also differ in elapsed time, since senior roles take 37% longer to fill than junior ones and technical roles about 15 days longer than business roles - Ashby Recruiting Operations Benchmarks. In the worked example later, a 400-person company plans 60 growth hires and 50 backfills, fills 10 roles internally, and splits its 100 external hires into 30 volume, 45 standard, 20 hard and 5 leadership roles. With the hiring plan settled, the next question is what a sensible total looks like.
3. How Much Should Recruiting Cost? Benchmarks That Hold Up
There is no reliable public benchmark that tells you what share of payroll or revenue to spend on recruiting, so build the budget bottom-up and use cost per hire as the sanity check. The research firms that measure talent acquisition spend as a share of revenue or per employee, such as Gartner and APQC, keep those figures behind client paywalls, and the free numbers that circulate online usually trace back to vendor blogs with no dataset behind them. What is published, and reliable, is cost per hire by role type, recruiting's share of the HR budget, and a growing body of workload data from applicant tracking system vendors. Used together, these tell you whether your bottom-up number is in a sensible range.
The most cited benchmark is also the most misread. SHRM's 2025 benchmarking survey of 2,371 member organizations, fielded in early 2025, reports both averages and medians, and they tell very different stories. The averages, $5,475 for a non-executive hire and $35,879 for an executive, appear in SHRM's press release - SHRM. The medians, $1,200 and $10,625, appear in the data brief, which also shows the non-executive median falling from $1,633 in 2017 while the executive median more than doubled from $5,000. Averages are pulled up by a minority of very expensive hires; medians describe the typical hire.
What SHRM counts, and what it leaves out
SHRM defines cost per hire as the sum of third-party agency fees, advertising agency fees, job fair costs, online job board fees, employee referral costs, travel costs of applicants and staff, relocation costs, recruiter pay and benefits, and talent acquisition system costs, divided by the number of hires. SHRM's own workforce analytics guidance cites the American National Standard for cost per hire and summarizes it as the sum of recruiting costs divided by the number of hires - SHRM workforce analytics report. It is a good definition for comparing organizations, and it maps neatly onto most of the 22 lines in this template.
It also leaves out two things that matter in a real budget. The first is hiring-team time: the hours that engineers, managers and executives spend interviewing, which for technical roles can exceed the entire SHRM median in value. The second is sign-on bonuses, which many companies pay out of the compensation budget rather than the recruiting budget. This template lists both, so your own cost per hire will look higher than SHRM's if you include them. That is not a problem as long as you know which definition you are comparing against. When you present the budget, quote your cost per hire on the SHRM definition and show the fuller figure separately.
Recruiting's share of the HR budget
The one budget-share benchmark SHRM publishes is recruiting as a percentage of the total HR budget. In 2025 the average was 26%, the median 20%, and the middle half of organizations sat between 10% and 39% - SHRM. The spread is so wide because it depends almost entirely on hiring volume relative to headcount, which is exactly why a top-down percentage makes a poor budgeting rule. A company growing 20% a year and one replacing 5% of its staff can both be well run with very different shares.
Use the share as a conversation tool rather than a target. If your bottom-up recruiting budget comes out at 45% of HR spend, the number itself is not wrong, but it signals that you will need to explain the hiring plan behind it. If it comes out at 8% while you are planning to grow headcount by a quarter, you have probably left out lines, most often backfills, agency fees or the recruiters themselves. The same logic applies to SHRM's 2026 finding that executive cost per hire "increased substantially" while non-executive cost stayed relatively stable, with non-executive roles taking a median of 39 days to fill - SHRM 2026 executive summary. Executive searches are where budgets most often slip.
Workload benchmarks: what one recruiter can carry
Recruiter capacity is the benchmark that sizes the biggest line in most budgets, and the best current data comes from applicant tracking system vendors, whose customer bases skew toward technology and growth companies. Gem's 2026 report, covering 165 million applications and 1.2 million hires from June 2021 to May 2025, puts the average at 29 hires per recruiter a year, down from 50.5 in 2021, with each recruiter carrying 13.4 open requisitions at a time and handling 5,327 applications a year - Gem 2026 Recruiting Benchmarks Report. Ashby's separate dataset of 109 million applications shows hires per recruiter recovering from a low of 4.5 a quarter in early 2023 to 7.3 a quarter by early 2026, which is also roughly 29 a year - Ashby Recruiter Productivity.
The chart below, from Gem's benchmark report, shows the steady rise in the number of open jobs each recruiter manages at the same time. It is the clearest picture of why so many talent teams feel stretched even though hiring volumes are below their peak.
Each recruiter now carries about 40% more open jobs than in 2021
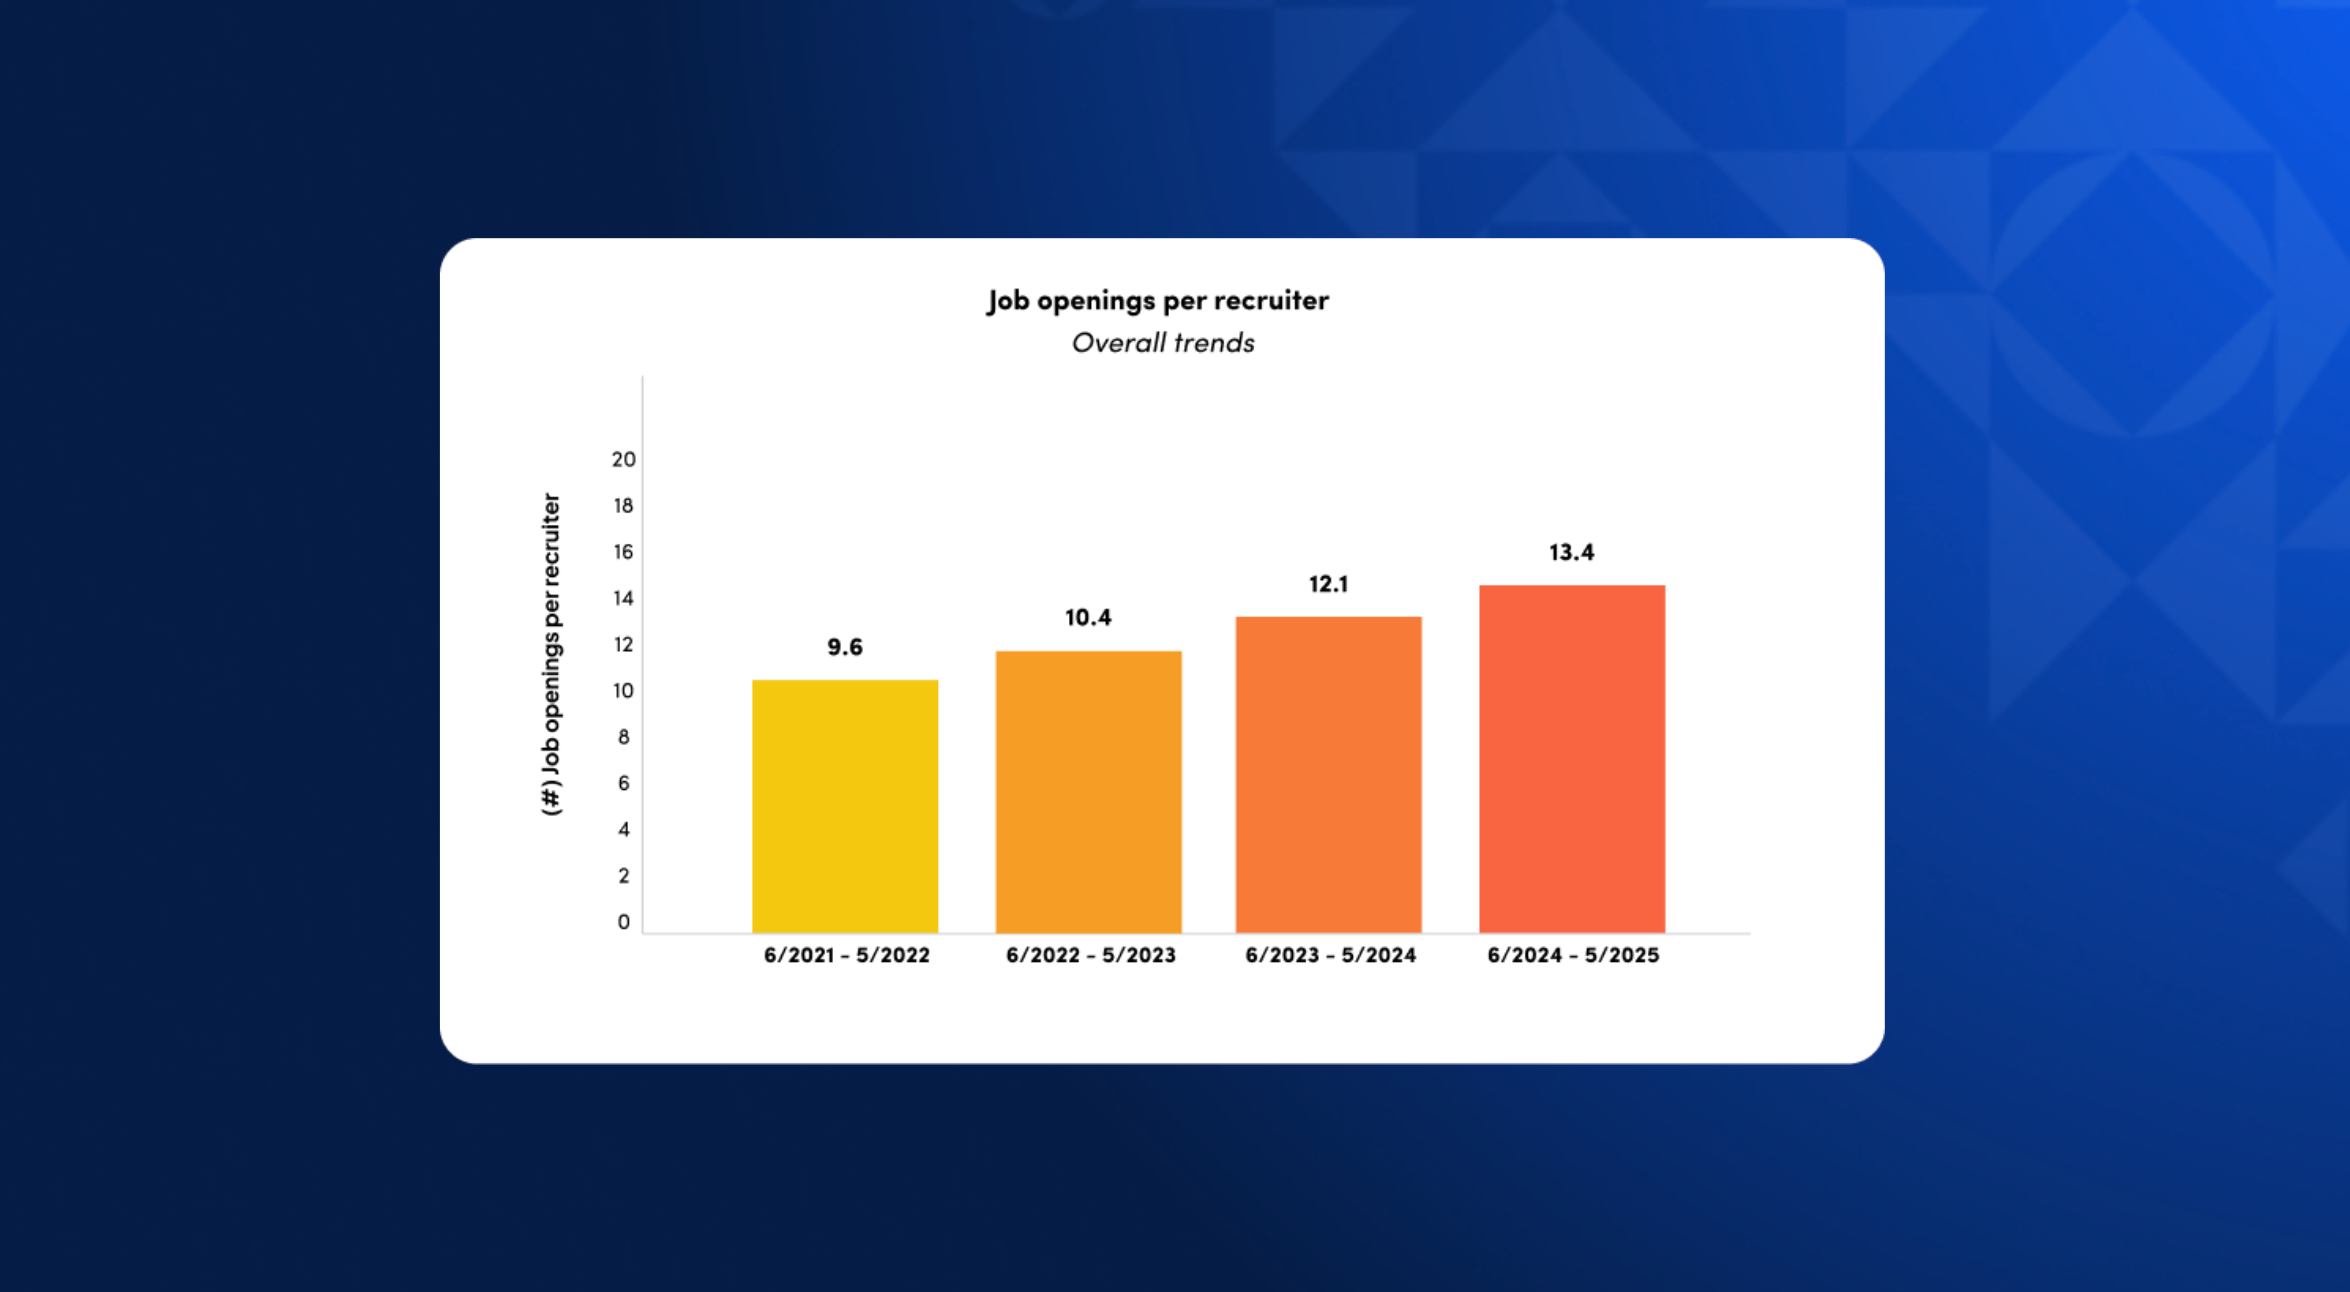
The bars climb from 9.6 to 13.4 open roles per recruiter in four years, while hires per recruiter fell. The two facts fit together: each role now takes more work, because applications per hire have roughly tripled since 2021 according to Ashby, and companies run more interviews before making an offer. Greenhouse's own benchmark of 6,000-plus companies shows the same squeeze from another angle, with annual applications per recruiter rising from 1,610 in 2022 to 4,890 in 2025 while the average number of recruiters per organization fell from 10.43 to 4.62 - Greenhouse recruiting benchmarks.
Advertising benchmarks: cost per applicant and cost per hire
For the advertising lines, the most useful public dataset comes from Appcast, which runs programmatic job advertising for about 1,200 employers. Its 2026 report, built on roughly 302 million clicks and 27 million applications, found that the median cost per application rose sharply in 2025 to $19.32, and the median cost per hire reached $1,340, the latest month it reports being October 2025 - Appcast 2026 Recruitment Marketing Benchmark Report. For technology roles, its median cost per hire jumped from $1,364 in 2024 to $2,795 in 2025.
These numbers cover advertising spend only, not recruiter time, and they skew toward the high-volume and hourly roles that programmatic advertising serves best. They are still the best way to price the job advertising line: estimate how many of your hires will come from ads, multiply by the relevant cost per hire, and adjust for your mix. The practical lesson from all these benchmarks is that each one prices a different slice, so the budget has to be assembled line by line. The next section starts with the largest slice, the people.
4. Lines 1-5: The People Budget
People are the largest fixed block in almost every in-house recruiting budget, and the number of recruiters you need follows directly from your hiring plan and their capacity. In the worked example later in this guide, the talent leader, three recruiters, a coordinator and three months of contract help come to about $621,000, or 46% of the total. Get this block right and the rest of the budget has a solid base; get it wrong and you either pay for idle capacity or, more commonly, pay agencies to absorb the work your team cannot.
Every salary in this block should be loaded, meaning salary plus the employer's cost of benefits and payroll taxes. The Bureau of Labor Statistics reports that in June 2026 private-industry employers spent $46.89 an hour on compensation, of which $32.82 was wages and $14.07 (30.0%) was benefits - BLS Employer Costs for Employee Compensation. Dividing one by the other gives a 1.43x multiplier, but that overstates the cost of a salaried hire, because BLS counts paid leave as a benefit even though it is already paid out of the quoted salary. Moving paid leave back into salary gives a loaded factor of roughly 1.23x to 1.28x for professional occupations, as our analysis of the true cost to hire an AI engineer shows in detail. This template uses 1.25x throughout.
Line 1: Talent leadership
The head of talent acquisition is the line people most often leave out, either because the role sits in the HR budget or because a founder or HR generalist does the job part time. Both are fine, but the cost should appear somewhere, because leadership time spent on recruiting is time not spent elsewhere. For a full-time leader, the most neutral public reference is the Bureau of Labor Statistics occupation "human resources managers", whose median annual wage was $149,280 in May 2025, with a mean of $164,230 - BLS Occupational Employment and Wage Statistics.
At a 1.25x loaded factor, a $150,000 talent leader costs about $187,500 a year. In smaller companies the leader usually carries requisitions too, typically the senior and executive roles that need a senior conversation partner, which reduces the load on the recruiters below. Count those hires in the capacity math for line 2. In larger companies the leader manages managers and carries no requisitions at all, and the leadership line may include a recruiting operations or analytics lead, whose main job is to keep the data clean enough that the budget can be measured against reality during the year.
Line 2: Recruiters and sourcers
The recruiter line is a capacity calculation: hires handled in-house divided by hires per recruiter, multiplied by the loaded cost of a recruiter. The benchmark from the previous section is about 29 hires per recruiter a year, but it varies with role mix and company size. Gem's data shows engineering recruiters averaging just 11.1 hires a year, while a recruiter running volume roles can make several times that. Size your team by role group: count volume hires, standard hires and hard hires separately, and apply a different capacity to each.
Ashby measures capacity a different way, by counting how many jobs each person actively works on in a week at the busy end of the range (the 90th percentile), across more than 26 million recruiting interactions. The chart below shows that recruiters handle 10 to 14 jobs a week at peak depending on company size, sourcers 8 to 12, and recruiting coordinators 8 to 26.
Peak weekly workload by role and company size
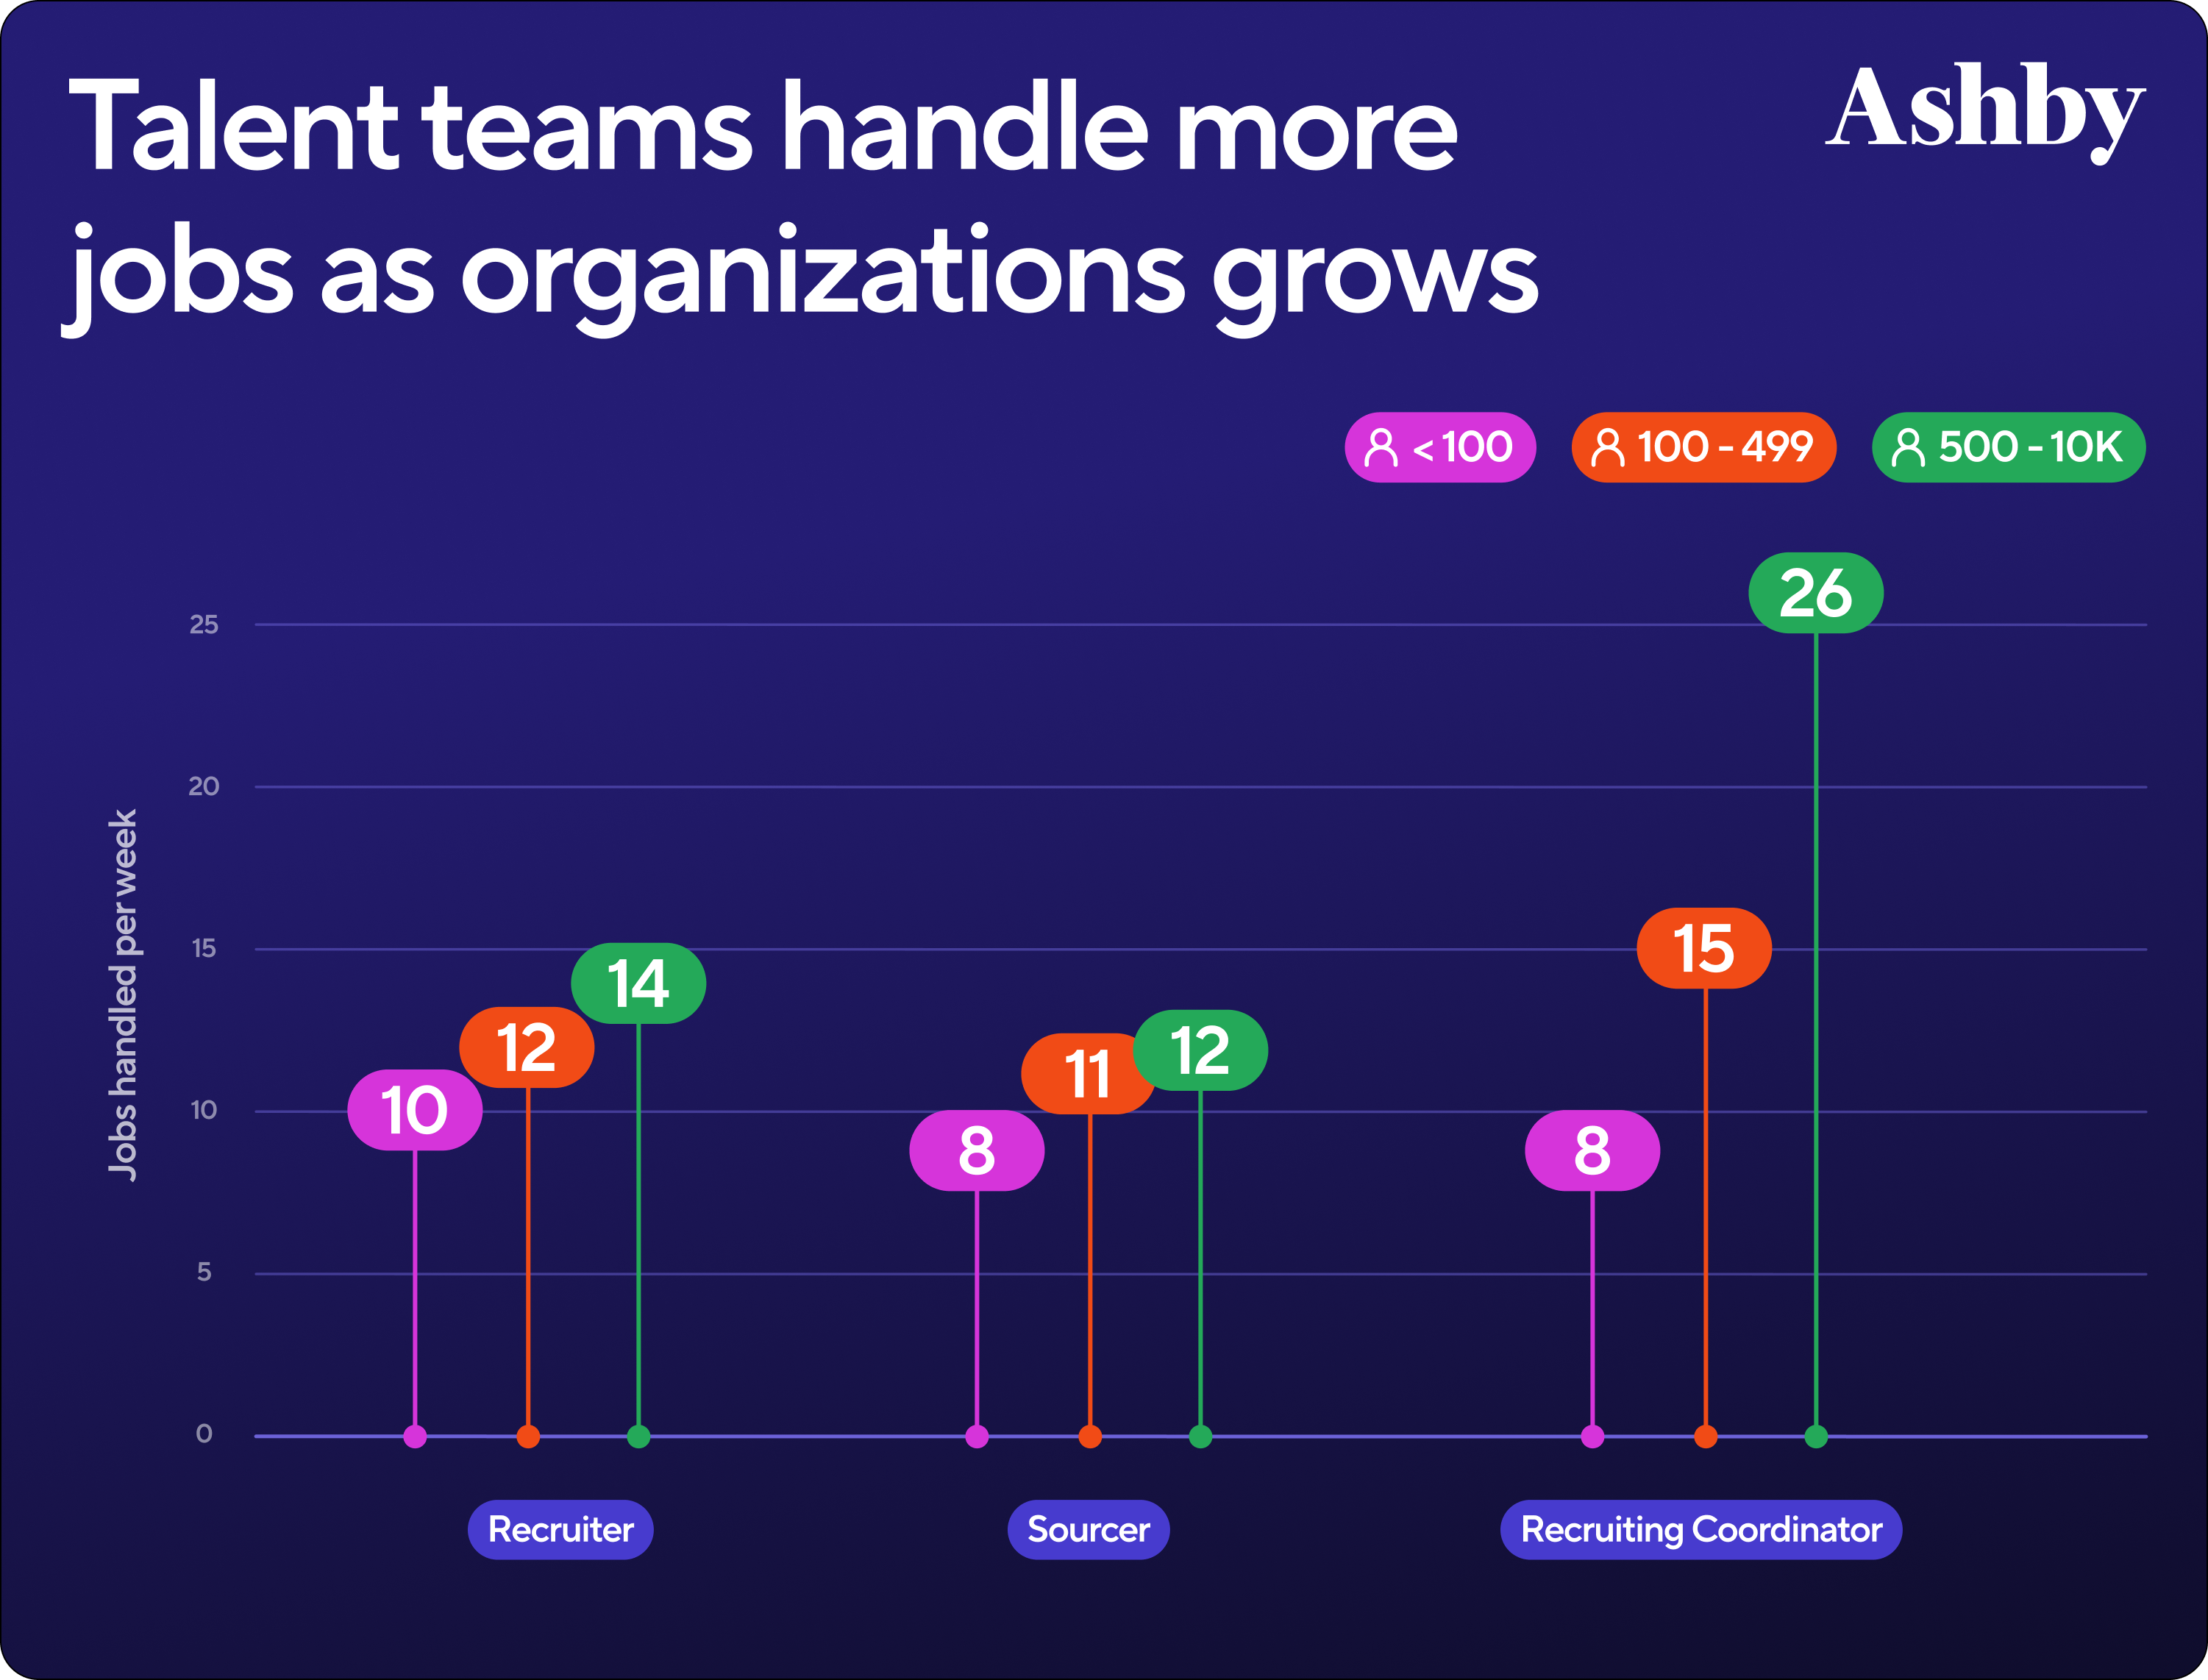
The striking number is the coordinator column, where workload at companies with 500 to 10,000 employees is more than three times that at companies under 100 - Ashby Recruiter Capacity. Coordinators scale with interview volume rather than with headcount, which is why they belong on a separate line. For recruiter pay, the closest public reference is the BLS occupation "human resources specialists", which includes recruiters and had a median wage of $75,940 and a mean of $81,990 in May 2025 - BLS. Technical and senior recruiters in high-cost cities earn well above that, so this guide uses $85,000 as a blended base, or $106,250 loaded.
Capacity planning is also a negotiation with finance, not just a formula. The panel below, recorded at Ashby One London in September 2026, features talent leaders from Legora and poolside explaining how they agree hiring capacity with their finance teams and protect the quality bar when the plan is tight (the capacity planning discussion starts at about 12:04).
Hiring Excellence in 2026: Capacity Planning and Quality Bar
Two points from that conversation translate directly into budget practice. First, agree with finance on a capacity assumption per recruiter, in writing, before the year starts, so that a mid-year request for another recruiter is a mechanical consequence of more hires rather than a fresh debate. Second, embedded recruiters who sit inside a department make capacity visible to that department's leader, which makes it easier to charge recruiting cost back to the teams that create it.
Line 3: Coordinators and recruiting operations
Recruiting coordinators schedule interviews, manage candidate communication and keep the applicant tracking system clean. The usual planning ratio is one coordinator for every three or four recruiters, but the Ashby data above suggests a better driver: interview volume. Gem found that the average number of interviews per hire rose by 33% between 2021 and 2025, to about 20, and smaller companies saw interviewer hours roughly double. More interviews mean more scheduling, rescheduling and feedback chasing, and that work lands on coordinators.
For pay, the BLS occupation "human resources assistants, except payroll and timekeeping" had a mean annual wage of $52,250 and a median of $50,610 in May 2025 - BLS. Loaded at 1.25x, a $52,000 coordinator costs about $65,000. This is also the line where software substitutes for people most directly. Automated scheduling tools inside modern applicant tracking systems reduce the time spent booking interviews, and Ashby's operations benchmark found automated scheduling to be 26% faster than manual scheduling. If your plan includes such a tool, you may be able to support four or five recruiters per coordinator instead of three.
Line 4: Flex capacity, from contract recruiters to RPO
Hiring rarely arrives evenly across the year. Campus seasons, a new office, a product launch or a funded expansion all create peaks, and a team sized for the average will be overloaded during them. The flex capacity line pays for temporary help: contract recruiters billed by the hour, a recruitment process outsourcing (RPO) provider that takes over a slice of hiring, or project-based search. Budgeting this line explicitly is cheaper than the usual alternative, which is to let peak roles drift to contingency agencies at 20% or more of salary.
Hourly rates for contract recruiters are rarely published, but the US government's pricing database offers a real benchmark. GSA's CALC tool lists the ceiling hourly rates awarded to vendors on federal schedules. Across the 76 labor categories with "recruiter" in the title, from 27 vendors, the median ceiling rate is about $89 an hour, with the middle half between roughly $64 and $114; leaving out coordinator, assistant and volunteer-recruiter titles raises the median to about $96 - GSA CALC+ (our query, October 2026). These are fully burdened rates, including the vendor's overhead and margin, so they compare directly with an agency invoice. Three months of full-time contract help at $96 an hour comes to about $49,900.
RPO pricing is harder to benchmark because providers quote it privately, usually as a monthly management fee, a fee per hire, or a mix of both. Treat any RPO proposal as a capacity purchase and compare it with the equivalent in-house cost: if an RPO charges a fee per hire, multiply it by the hires it will handle and compare the total with loaded recruiter cost plus tools for the same volume. RPO tends to win when volume is high and predictable, or when you need a capability, such as a new country, that would take months to build internally.
Line 5: Hiring-team time, the shadow line
The most expensive recruiting cost in many companies never appears in the recruiting budget at all: the time hiring managers and interviewers spend screening, interviewing and debating candidates. It is not a cash line, because those people are paid anyway, but it is a real cost that competes with their day jobs. Gem's 2026 report measures about 26 interviewer hours per hire for technical roles and about 12 hours for non-technical roles, with technical roles averaging around 36 interviews per hire.
Show this line as a shadow cost below the cash budget. In the worked example, 25 technical and leadership hires at 26 hours and 75 other hires at 12 hours add up to about 1,550 interviewer hours, which at a loaded cost of $90 an hour is roughly $139,500, more than the entire technology block. Putting the number in front of leadership changes behavior: it makes a case for structured interviews, shorter loops and better screening before the onsite, because every unnecessary interview round costs real engineering and management time. The people block sets your capacity; the technology block, next, decides how much each person can do.
5. Lines 6-10: The Technology Budget
Recruiting software is a smaller share of the budget than most vendors imply, about 6% of the total in this guide's worked example, but it is where many talent teams plan to invest, and the block most likely to contain waste. In the worked example, five technology lines cost about $85,000 in total, against $621,000 for people. Yet technology decisions shape the people budget: a better sourcing tool can raise recruiter capacity, and an applicant tracking system with built-in scheduling can reduce the need for coordinators. The right question for each line is not "what does it cost" but "what does it replace".
Technology spend is also where budgets go stale fastest, because tools are bought one at a time and rarely retired. Employ's 2025 Recruiter Nation survey of talent acquisition professionals found that 67% planned to increase their spending and 52% planned to invest in new recruiting technology, while 76% expected to replace their primary recruiting platform within two years - Employ Recruiter Nation Report 2025. Before adding a line for 2027, list every recruiting tool you pay for today, who uses it, and what it overlaps with. Look in particular for seat-based tools that nobody has logged into for a quarter, because they renew silently.
The table below gathers the reference prices used in this section. Vendr figures are median negotiated annual contracts from its marketplace, which reflects what companies actually paid rather than list price; the others are list prices from each vendor's own pricing page.
| Tool | Category | Reference price | Basis |
|---|---|---|---|
| Greenhouse | ATS | $26,570 a year | Vendr median, 884 purchases |
| Ashby | ATS | $22,896 a year | Vendr median, 161 purchases |
| Lever | ATS | $15,400 a year | Vendr median, 318 purchases |
| Workable | ATS | $299-$719 a month | List, smallest company-size band |
| LinkedIn Recruiter | Sourcing seats | £8,925-£6,750 per seat a year | UK G-Cloud list, by seat count |
| hireEZ | AI sourcing | $494 a month | List, solo recruiter |
| Juicebox | AI sourcing | $99-$199 per seat a month | List, Starter and Growth |
| Gem | CRM and sourcing | $25,699 a year | Vendr median, 234 purchases |
| HackerRank | Technical assessment | $13,533 a year | Vendr median, 186 purchases |
| Checkr | Background checks | $29.99-$94.99 per report | List, Basic to Complete |
Two warnings apply to every row. Negotiated medians hide wide ranges: Vendr's Ashby range runs from about $8,000 to nearly $119,000 a year depending on company size and modules. And list prices are starting points, since the larger your company, the more of the price depends on headcount bands, add-ons and multi-year terms. Use the table to set a credible first number, then replace it with real quotes during your renewal cycle.
Line 6: Applicant tracking system
The applicant tracking system is the backbone of the budget, because it is where requisitions, candidates and costs are recorded, and the tool every other line integrates with. Negotiated prices for the main mid-market systems cluster in a band that is narrower than people expect. Vendr's marketplace shows median annual contracts of $26,570 for Greenhouse, $22,896 for Ashby and $15,400 for Lever - Vendr Greenhouse. Enterprise suites such as Workday are bought as part of a much larger human resources contract, so the recruiting module rarely has a separate price you can isolate.
Smaller companies have published options. Workable lists Standard at $299 a month, Premier at $599 and Enterprise at $719 for its smallest company-size band, with prices rising for larger bands - Workable pricing. Manatal publishes per-user pricing and is one of the cheapest full systems on the market. For budgeting, what matters most is the pricing unit: some systems price by employee count, some by user, some by active job, and the unit decides how the bill moves when your plan changes. A system priced by employee count gets more expensive as you grow even if you hire fewer people.
Manatal
If the ATS medians above look large for a company making 30 to 100 hires a year, Manatal is the published-price alternative worth pricing first: $15 per user a month billed annually ($19 monthly). The honest caveat is the cap. That tier stops at 15 active jobs and 10,000 candidates, which most 100-hire plans will exceed, so budget the $35 tier ($39 monthly) with unlimited jobs. Five users on it come to about $2,100 a year. If your IT team requires single sign-on or API access, those sit on the $55 tier. There is a 14-day trial with no card.
Whichever system you choose, budget implementation and migration separately from the subscription. Switching systems means moving candidate records, rebuilding job templates and interview plans, and retraining hiring managers, and the switching year usually costs more than either system alone. If you are replacing your system in 2027, put the overlap months and the migration work on this line rather than letting them leak into "miscellaneous".
Line 7: LinkedIn Recruiter and sourcing seats
LinkedIn Recruiter remains the default sourcing seat for professional hiring, and it is one of the few recruiting tools with a published rate card, albeit in an unusual place. LinkedIn's price list on the UK government's G-Cloud marketplace, dated May 2024 and still the listed document in October 2026, shows annual per-seat prices falling with volume: £8,925 for one or two seats, £8,575 for three to ten, down to £6,750 for 101 to 250, each including at least 150 InMails a month - LinkedIn on G-Cloud. At the exchange rate of October 2026, a seat in the three-to-ten band is about $11,300 a year.
LinkedIn now sells an AI layer on top. Hiring Assistant, its recruiting agent, is an add-on to Recruiter licenses with monthly capacity tiers per license, from 200 sourced candidates and 3,500 evaluated applicants at Tier 1 to 1,500 and 25,000 at Tier 3, with unused capacity expiring each month - LinkedIn Help. LinkedIn's own figures claim 66% higher InMail acceptance with Hiring Assistant than with traditional sourcing, which is vendor-reported. Our breakdown of LinkedIn Hiring Assistant 2 covers the add-on's pricing and limits in more detail.
The budgeting decision is how many seats you need, not whether to buy LinkedIn at all. Recruiters who mainly run inbound volume roles rarely need a full seat, while sourcers and recruiters on hard roles usually do. A common pattern for 2027 is to keep full seats for the people who source every day and move occasional sourcing to cheaper AI tools that search LinkedIn and other sources together, which brings us to the next line.
Line 8: AI sourcing and outreach
AI sourcing tools are the fastest-moving line in the template, and they are priced in ways that make comparison tricky: per seat, per credit, per agent or per monthly allowance. Published prices give a usable range. hireEZ lists solo plans from $494 a month, which is the rate when paying annually upfront (about $5,929 a year) - hireEZ pricing. Juicebox lists its Starter and Growth plans at $99 to $199 per seat a month depending on plan and billing period, plus a $199-a-month add-on for each autonomous agent - Juicebox pricing. Metaview's sourcing product lists Pro at $100 and Max at $300 per user a month - Metaview pricing. Negotiated medians on Vendr run higher because they cover teams: about $13,000 a year for hireEZ, $20,000 for SeekOut and $26,147 for Juicebox.
The value of this line shows up in the people block. A tool that searches hundreds of millions of profiles, screens them against the role and drafts personalized outreach can lift the number of hard roles a recruiter carries, or keep a role out of an agency's hands. Gem's data is the strongest argument for budgeting here: sourced candidates are nearly eight times more likely to be hired than inbound applicants - Gem. Direct sourcing produced 11% of hires from just 2.6% of applications.
Among the tools in this category, HeroHunt.ai prices by monthly allowance rather than by seat or by role. Plans start at $99 a month with unlimited positions and searches, metered on AI-screened and matched profiles delivered and candidate emails found, which makes the cost of an extra open role zero until the allowance runs out.
HeroHunt.ai
If your plan has 15 to 30 hard roles that would otherwise drift to contingency agencies, this is the line to fund first, and HeroHunt.ai is built for it: it searches about a billion profiles, screens them with language models against your criteria and runs personalized outreach. Plans start at $99 a month with unlimited positions, metered on matched profiles delivered and candidate emails found (5,000 profiles and 1,000 emails a month on Pro), so adding a role mid-year does not change the bill. The honest caveat: it finds and contacts candidates, but it does not replace your applicant tracking system or run interviews, and a burst of urgent roles can use up a month's allowance early. The 8-day trial requires a card.
Whatever you choose, budget AI sourcing per recruiter who will actually use it, and plan a measured pilot rather than a company-wide rollout. LinkedIn's head of global talent acquisition has recommended small, controlled AI pilots over multi-year implementations - Recruiting News Network. That advice applies to every vendor in this category, including LinkedIn itself. Measure the pilot on the cost of filling hard roles, not on activity metrics such as messages sent.
Line 9: Contact data
Contact data tools find email addresses and phone numbers for sourced candidates, and they are the line most likely to be double-counted, because many AI sourcing tools now include contact credits. Check before you buy. If you need a standalone tool, Apollo lists its Basic plan at $49 per seat a month billed annually, or $65 month to month, while Lusha lists plans at $49.90, $69.90 and $399.90 per user a month. Negotiated medians on Vendr are about $19,000 a year for Apollo and $33,500 for ZoomInfo, which reflect larger sales-team purchases rather than recruiting seats.
For a recruiting team, a few seats of a mid-tier plan are usually enough, and the cost is small next to the other lines: four Apollo Basic seats come to about $2,350 a year. The bigger risk is compliance rather than cost. Contact data about candidates in the European Union falls under data protection rules, so whoever owns this line should confirm the vendor's legal basis for its data and keep outreach to sourced candidates proportionate and easy to opt out of.
Line 10: Assessments, scheduling and interview tools
The last technology line covers everything between application and offer: skills assessments, coding tests, video interviewing, interview scheduling and interview note-taking tools. Prices vary more here than anywhere else in the block, because tools are priced by candidate, by seat or by platform. Technical assessment platforms are the biggest item for companies hiring engineers: Vendr's median annual contract is $13,533 for HackerRank and $15,000 for Codility - Vendr HackerRank. TestGorilla, which covers general skills tests, lists its Core assessment plan from $215 a month billed annually - TestGorilla pricing.
Video interviewing and interview intelligence tools add more. HireVue's median contract on Vendr is about $20,900 a year. Before adding these, check what your applicant tracking system already includes: several modern systems now bundle scheduling, interview notes and AI summaries, and paying twice is a common source of waste. In the worked example this line is about $16,100, a coding test platform plus a general assessment plan, with scheduling and notes assumed to come with the applicant tracking system. With the tools priced, the next block covers how candidates find you in the first place.
6. Lines 11-14: The Attraction Budget
Attraction lines pay for candidates to find you, and they are the easiest block to scale up or down during the year because most of the spend is bought month by month. That flexibility is also the risk: job advertising budgets tend to grow quietly when roles stay open, because the default response to a slow role is to raise the daily budget. In the worked example, the four attraction lines (job ads, employer brand, events and referral bonuses) come to about $130,000, under 10% of the total, but they produce more than half of the hires.
The best way to budget this block is from the hire backwards. Decide how many hires each channel should produce, based on your own source-of-hire data, and multiply by that channel's cost per hire. Gem's benchmark data gives a useful starting split when your own history is thin. The chart below shows the share of hires by source channel across its customer base.
Where hires come from
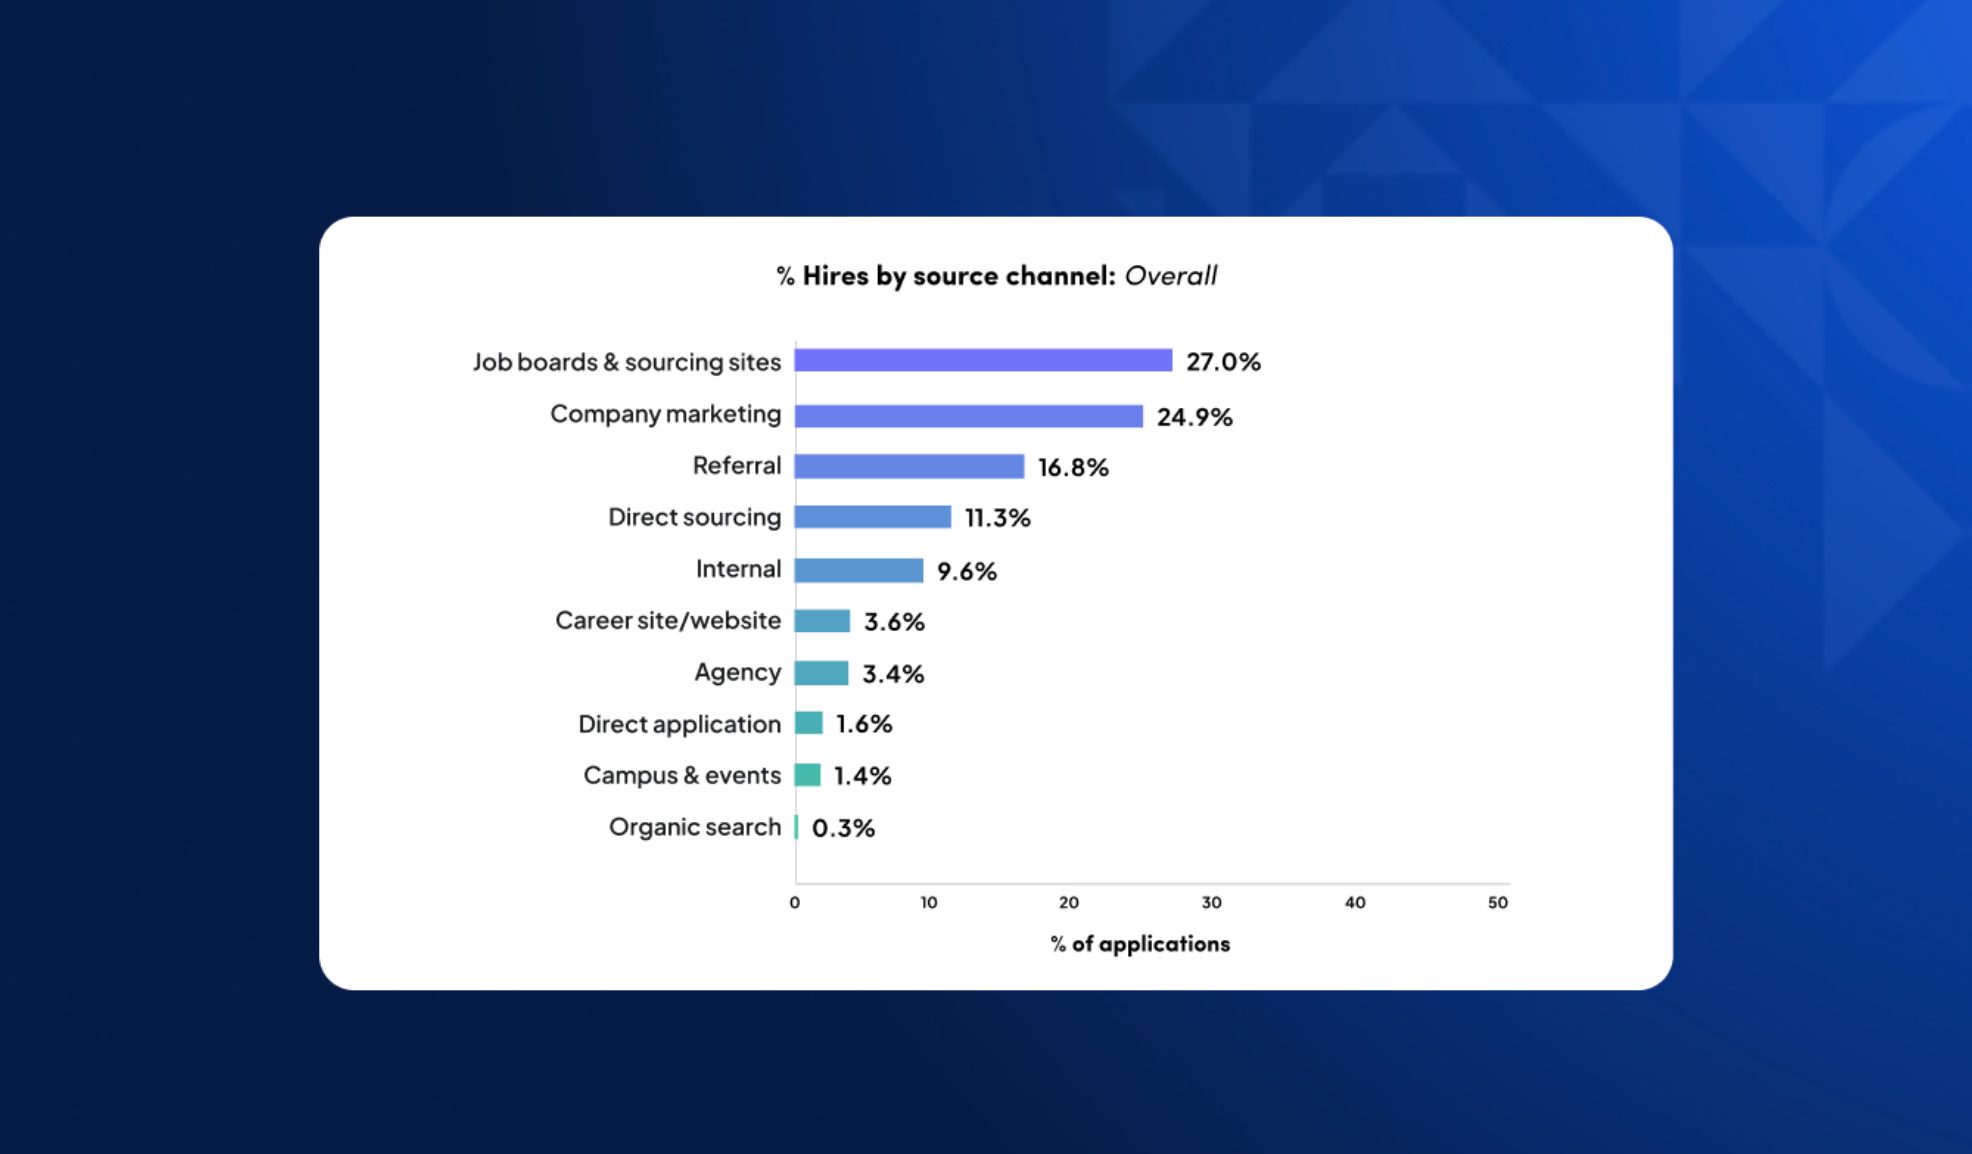
Job boards and sourcing sites produce about 27% of hires and company marketing about 25%, while referrals produce 16.8%, direct sourcing 11.3% and agencies just 3.4% - Gem 2026 benchmark takeaways. The same report shows that job boards and company marketing generate roughly 90% of applications but only about half of hires, which is why advertising is cheap per application and much more expensive per hire. Use these shares as a first draft of your channel plan, then adjust for your role mix: volume roles lean on job ads, hard roles on sourcing and referrals.
Line 11: Job advertising
Job advertising has moved almost entirely to performance pricing, where you pay for clicks or applications rather than for a posting. Indeed's sponsored jobs charge for job-seeker interactions (a click or a started application) against a budget you set, and bill on the first day of each month or whenever spending reaches $500, whichever comes first - Indeed pricing. LinkedIn's promoted jobs work on a daily budget with a cost per click that varies by location, title and competition, and LinkedIn says you can save up to 35% by buying job-posting budget in advance - LinkedIn Jobs pricing tipsheet.
Because neither platform publishes a fixed price, budget this line from cost per hire rather than from cost per posting. Appcast's median advertising cost per hire of about $1,340 across roles (the trailing three months to October 2025) is a reasonable default, and its $2,795 figure for technology roles in 2025 is a better fit for engineering hires - Appcast. For a sense of typical platform spend, ZipRecruiter's annual report shows company revenue per paying employer of roughly $1,690 to $1,890 per quarter in 2025, an average across all its customers rather than a per-hire figure - ZipRecruiter 10-K. Our guide to Indeed pricing for employers goes deeper on that platform's budget mechanics.
In the worked example, 36 general hires are expected from job ads at $1,340 each and 4 technical hires at $2,795, for a line of about $59,400. Add a rule to the budget: any role that has been advertised for 30 days without a qualified shortlist moves to sourcing, rather than receiving a higher daily budget. That single rule prevents the most common overspend in this block.
Line 12: Employer brand and careers site
Employer brand spending covers your careers site, paid company profiles on job and review sites, photography and video, and the content that persuades sourced candidates to reply. It is the hardest line to measure, which makes it the first to be cut and the first to be overspent, depending on who owns it. The most concrete anchor comes from LinkedIn's UK public-sector G-Cloud price list, dated May 2024, which lists its Career Pages (Life tab) product at £12,100 for the Basic tier for companies with 150 to 1,000 members, rising to £34,000 for Premium; treat it as an order-of-magnitude guide rather than a quote - LinkedIn on G-Cloud. The same rate card lists annual job slots from £1,465 per slot for small volumes.
Keep this line small unless you have evidence that brand is the constraint. The signal to look for is a low reply rate to sourcing outreach or a low offer acceptance rate, both of which suggest candidates do not know or do not trust the company. If both are healthy, extra brand spending is unlikely to produce more hires than the same money spent on sourcing. In the worked example, a LinkedIn Career Page at about $16,000 covers this line, with content produced in-house.
Line 13: Events and campus
Events and campus recruiting cover career fairs, university partnerships, sponsorships, hackathons and the travel to attend them. This line matters most for companies that hire early-career talent in volume, and Gartner names the redesign of early-career pipelines as one of its four talent acquisition trends for 2026, alongside AI-first high-volume recruiting - Gartner. Gem's data, however, puts campus and events at only 1.4% of hires across its customers, so for most companies this is a small, targeted line rather than a major channel.
Budget events as a list of named events with a cost and an expected number of hires each, not as a lump sum. That makes it easy to cut the weakest event when money is tight and to justify the strongest. In the worked example, $12,000 covers two university events and the travel to attend them; that figure is an assumption, so replace it with your own event list.
Line 14: Referral bonuses
Referral bonuses are the cheapest high-quality channel in most budgets, and they are paid only when a referred candidate is hired and stays. Gem reports that referrals convert at 11 times the rate of inbound applicants, and they produce about one in six hires. The bonus amounts themselves are surprisingly poorly benchmarked, but one employer association survey of 82 companies, published in February 2024, found an average referral bonus of $1,936 across the 52 companies with a program, and $2,536 for exempt supervisory, managerial and professional roles, a figure based on only four companies - AAIMEA Employee Referral Survey. It is a small, regional sample, mostly companies under 250 employees, so treat both numbers as rough anchors rather than a market rate.
Budget the line as expected referral hires multiplied by the bonus, and remember that most programs pay after a retention milestone such as 90 days, so some of the 2027 cost falls into 2028. In the worked example, 17 referral hires at $2,500 come to $42,500. Raising the bonus is rarely the best way to get more referrals; respondents to the same survey reported raising bonuses several times without significantly lifting participation. Making referring easy, and asking specific employees about specific roles, usually works better than more money. The attraction block brings candidates in; the next block covers what it costs to actually hire them.
7. Lines 15-20: The Per-Hire Budget
Per-hire costs are triggered only when someone is hired, and they contain the single most expensive line in most recruiting budgets: agency fees. In the worked example, six per-hire lines add up to about $442,000, a third of the total, and agency fees for just five of the 100 hires account for about $302,000 of that. The other per-hire lines (background checks, candidate travel, relocation, immigration and sign-on bonuses) are individually small but add up, and several of them have changed in 2026 in ways a 2025 template would miss.
The discipline for this block is to attach every line to specific hires in the plan. "Agency fees: $300,000" is a number finance will cut; "two executive searches and three senior engineering roles that our team cannot fill in time, at 33% and 25% of salary" is a plan finance can evaluate. The same goes for relocation and immigration, which should be tied to named roles or to a clear rule about when the company will pay.
Line 15: Agency and search fees
Agency fees are set out in agencies' published terms of business, and the real rates are higher than many buyers assume. Robert Walters' New York terms set a default fee of 30% of the candidate's salary package when no other rate has been agreed - Robert Walters terms. Reed in the UK publishes permanent fees of 22%, 25% and 27% of total first-year remuneration depending on service level - Reed terms of business. At the top of the market, Korn Ferry's 2026 annual report says its executive and professional search fees are "generally one-third" of the placed candidate's estimated first-year cash compensation, plus a percentage of the fee to cover indirect expenses - Korn Ferry 10-K.
New pricing models have appeared alongside the traditional ones. Jack & Jill's AI recruiter, Jill, charges 10% of first-year salary on success - Jack & Jill pricing. That fee model applies in the UK and Europe, while US employers are offered per-slot subscriptions instead, as our Jack & Jill pricing analysis explains. The AI talent agent Dex charges employers 20% to 30% of salary, exactly like a search firm - Fortune. Our analysis of recruitment agency fees in 2026 compares all of these models in detail, including the fine print on guarantees and fee bases that moves the final bill.
Budget agency fees role by role: salary multiplied by the fee rate, for each role you genuinely expect to send out. In the worked example, two executive searches on $250,000 first-year cash compensation at one-third come to about $166,700, and three senior engineering roles on $180,000 at 25% come to $135,000. The most effective budget control is a rule that a role can only go to an agency after a defined period of in-house search, with approval from the budget owner, because agency spend otherwise grows one "just this once" at a time.
Line 16: Background checks
Background checks are a small, predictable line priced per report. Checkr lists its packages from $29.99 (Basic), $59.99 (Essential) and $94.99 (Complete) per report, plus pass-through fees charged by courts and state agencies, with add-ons such as motor vehicle records at $9.50 - Checkr pricing. GoodHire lists identical tiers. Employment and education verification, credit checks for finance roles and drug tests for safety-sensitive roles add to the base package.
Budget one check per hire at the package your policy requires, plus a margin for candidates who receive a conditional offer but do not join. Pass-through fees vary by county and are the most common source of surprise, so add 10% to 20% if you hire across many US jurisdictions. In the worked example, 100 Essential checks at $59.99 come to about $6,000. The more important 2027 question for this line is identity verification, covered under line 21, because the rise of fraudulent candidates has made checking that a person is who they claim to be a separate step from checking their history.
Line 17: Candidate travel
Candidate travel covers flights, hotels and meals for candidates who come onsite for final interviews, and it has quietly returned as companies bring final rounds back in person. Two public numbers make it easy to price. The Bureau of Transportation Statistics reported an average US domestic airfare of $428 for the first quarter of 2026 - BTS. The US government's standard travel allowance for fiscal 2027 is $113 a night for lodging and $68 a day for meals and incidentals, or $181 a day, with higher rates in about 295 expensive locations - Federal Register.
A one-night onsite trip therefore costs roughly $700 with ground transport, more in expensive cities. Budget it as the number of candidates you expect to fly in multiplied by that trip cost; in the worked example, 20 onsite trips come to $14,000. The budget decision behind this line is a policy one: whether final rounds for remote roles need to be in person at all. If they do not, this line can drop close to zero.
Line 18: Relocation
Relocation is a lumpy line: few hires, large amounts. The best current data comes from Atlas Van Lines' annual corporate relocation survey of 549 relocation decision-makers, conducted in early 2026. The lump-sum range respondents ticked most often was $10,000 to $12,499, chosen by 26%, while 28% of companies used lump sums as a practice in 2025, down from 35% the year before - Atlas Van Lines 2026 Corporate Relocation Survey. Full-service relocations for senior people with a family and a house to sell can cost several times that.
The survey also shows why relocation budgets go unspent: 59% of companies had an employee decline a relocation in 2025, most often for family reasons or housing costs. Budget relocation for named roles where the candidate pool is genuinely elsewhere, and set a standard lump-sum amount by level so that each offer does not become a negotiation. In the worked example, four relocations at a $12,500 lump sum come to $50,000.
Line 19: Immigration and international hiring
Immigration costs for US hiring are set by the USCIS fee schedule, and they have risen. A new H-1B petition for an employer with more than 25 employees involves a $215 registration fee, a $780 base petition fee ($730 if filed online), a $1,500 training fee, a $500 fraud prevention fee and a $600 asylum program fee, with optional premium processing at $2,965 - USCIS fee schedule G-1055. Government fees alone come to about $6,500 per petition with premium processing, USCIS has flagged inflation adjustments to some fees from October 16, 2026, and immigration counsel adds more, so the worked example budgets two petitions at $10,000 each (an assumption to replace with your counsel's quote).
The bigger risk is policy. A September 2025 proclamation imposed a $100,000 payment on new H-1B petitions for workers outside the US. A federal court in Massachusetts vacated the guidance implementing it in June 2026, and USCIS says it is complying while the government considers next steps - USCIS. A new proclamation on September 18, 2026 extended the requirement to September 21, 2027, and whether the court orders reach it is unsettled - Mintz. Do not put $100,000 per petition into the base budget, but do model it as a scenario for any role that depends on a new H-1B from abroad. Our guide to hiring around the $100K H-1B fee covers the alternative visa routes.
For hires based outside your home country, an employer of record (EOR) employs the person on your behalf for a monthly fee. Deel lists EOR at $599 per employee per month, while Remote and Oyster list $699 and Papaya starts at $499. Three international hires on payroll for an average of six months in 2027 at $599 add about $10,800, which brings this line to roughly $30,800 in the worked example. Remember that from 2028 the full twelve months fall into the recurring payroll budget rather than recruiting.
Line 20: Sign-on bonuses
Sign-on bonuses have become less common since the 2022 peak but remain standard in some fields. Indeed's Hiring Lab found that about 3% of US job postings mentioned a signing bonus in December 2025, down from a peak of 5.6% in August 2022 but above the 1.8% average of 2019, with healthcare roles such as physicians and nurses far more likely to offer them - Indeed Hiring Lab. Atlas found that 49% of relocating companies used relocation or sign-on bonuses in 2025, down from 53%.
The key decision for this line is ownership. Many companies pay sign-on bonuses from the compensation budget, which keeps the recruiting budget clean but hides a real cost of hiring. Whichever budget owns it, write the rule down and keep it consistent, because a bonus that moves between budgets mid-year makes both of them impossible to track. In the worked example, the recruiting budget carries eight sign-on bonuses of $5,000 for hard-to-fill roles, or $40,000; this is an assumption to replace with your own policy.
8. Lines 21-22: Compliance, Fraud and the Reserve
The last two lines protect the budget from the risks that most templates leave out: new rules on AI in hiring, fraudulent candidates, and the plan itself changing. Together they come to about $72,000 in the worked example, roughly 5% of the total. Both lines are easy to cut because nothing appears to go wrong when they are missing, until the year something does.
Compliance and fraud have become real budget items in 2026 rather than theoretical risks. Several AI-in-hiring rules take effect in 2027, and candidate fraud has moved from an occasional problem to a standard part of screening. The reserve, meanwhile, is simply honest planning: the hiring plan you budget in October will not be the plan you run in June.
Line 21: Compliance and candidate verification
AI tools used in hiring decisions now fall under a patchwork of rules, and several deadlines land in or around 2027. New York City has required an independent bias audit within a year before using an automated employment decision tool since July 2023 - NYC DCWP, although a December 2025 state comptroller audit found enforcement "ineffective". California's privacy agency requires businesses using automated decision-making technology for significant decisions, including employment, to comply with its new rules from January 1, 2027 - California Privacy Protection Agency. Colorado replaced its original AI Act with a narrower law that takes effect on January 1, 2027, if the attorney general finishes rulemaking in time - Davis Polk.
In Europe, the AI Act treats AI used in recruitment as high-risk, and the Digital Omnibus agreement postponed those obligations to December 2, 2027 - Gibson Dunn. Our guide to recruiting under the EU AI Act explains what those obligations mean for recruiters. None of these regimes publishes a price, and bias audits are quoted individually, so the honest way to budget this line is a fixed allowance for an audit or legal review of each AI tool that influences who advances, plus internal time to update candidate notices.
Candidate fraud is the second part of this line. Gartner predicted in mid-2025 that by 2028 one in four candidate profiles worldwide could be fake, and 6% of 3,000 candidates it surveyed admitted to interview fraud, such as having someone else pose for them - HR Dive. Josh Bersin's August 2026 analysis, below, describes how fraudulent resumes and AI-generated applications have made the recruiting market more frustrating for employers and candidates alike.
The Messy World of AI-Powered Recruiting Where Nobody Is Happy
The practical response is a verification step before final interviews: an identity check, a live video conversation with camera on, and reference or employment verification for remote roles with access to systems or money. LinkedIn says Hiring Assistant 2 now shows recruiters a candidate's LinkedIn verification status alongside other trust signals - LinkedIn. In the worked example, $15,000 covers a bias audit or legal review and verification add-ons; it is an assumption, since none of these services publishes a standard price.
Line 22: Contingency reserve
The reserve exists because the hiring plan will change. Some roles will be cancelled, others added, a key leader will resign, and one hard role will need an agency after all. The BLS data in section 2 shows how much turnover can swing: the layoff rate doubled in 2020 and quits rose by almost a third in 2021. A budget with no reserve forces you to cut something else every time reality differs from the plan, which usually means cutting the cheapest channel (referrals, ads) to pay for the most expensive one (agencies).
A reserve of 10% of the variable lines (lines 11 to 20) is a sensible default; fixed lines need no reserve because they do not move with hiring volume. In the worked example, that comes to about $57,000. Set a rule for releasing it, for example "only for unplanned backfills of revenue-generating or regulated roles, with sign-off from the budget owner", so that it is not quietly absorbed by the first overspend. If the reserve is unspent by the third quarter, return it or roll it forward explicitly; either way, the decision should be visible. With all 22 lines priced, the next section puts them together into one complete budget.
9. The Complete Template: A Worked 2027 Budget
For a 400-person US software company making 100 external hires in 2027, the template produces a cash budget of about $1.35 million, or roughly $13,500 per hire. The example is illustrative, built from the sourced prices in the previous sections and a set of stated assumptions, so that you can see how the lines interact and replace each input with your own. Every assumption that is not a published price is labeled as one.
The hiring plan behind it comes from section 2: the company starts 2027 at 400 employees and plans to end at 460, so it needs 60 growth hires. It expects about 60 departures (roughly 14% of average headcount, a little below the information sector's 2025 quits rate) and will refill 50 of those roles, giving 110 openings, of which 10 will be filled by internal moves. That leaves 100 external hires: 30 volume roles (support and early-career), 45 standard professional roles, 20 hard technical roles and 5 leadership roles. Two executive searches and three senior engineering roles go to agencies; the head of talent handles the other three leadership roles, and three recruiters plus three months of contract help handle the remaining 92 hires, about 28 each once the contractor is counted.
| # | Line | Assumption | 2027 budget |
|---|---|---|---|
| 1 | Talent leadership | 1 head of talent, $150,000 base x 1.25 loaded | $187,500 |
| 2 | Recruiters | 3 recruiters, $85,000 base x 1.25 | $318,750 |
| 3 | Coordinator | 1 coordinator, $52,000 base x 1.25 | $65,000 |
| 4 | Flex capacity | 520 contract hours at $96 | $49,920 |
| 5 | Hiring-team time | 1,550 interviewer hours at $90 (shadow, not cash) | ($139,500) |
| 6 | Applicant tracking system | Mid-market system, near Ashby's Vendr median | $23,000 |
| 7 | LinkedIn Recruiter | 3 seats at £8,575, converted at 1.322 | $34,008 |
| 8 | AI sourcing and outreach | 4 users at about $200 a month (assumption) | $9,600 |
| 9 | Contact data | 4 Apollo Basic seats at $49 a month | $2,352 |
| 10 | Assessments | Coding test platform plus general skills tests | $16,080 |
| 11 | Job advertising | 36 hires at $1,340 plus 4 technical at $2,795 | $59,420 |
| 12 | Employer brand | LinkedIn Career Page Basic, £12,100 | $15,996 |
| 13 | Events and campus | Two university events (assumption) | $12,000 |
| 14 | Referral bonuses | 17 referral hires at $2,500 | $42,500 |
| 15 | Agency and search fees | 2 retained at one-third of $250,000; 3 contingency at 25% of $180,000 | $301,667 |
| 16 | Background checks | 100 Essential checks at $59.99 | $5,999 |
| 17 | Candidate travel | 20 onsite trips at $700 | $14,000 |
| 18 | Relocation | 4 lump sums at $12,500 | $50,000 |
| 19 | Immigration and EOR | 2 H-1B petitions at $10,000; 3 EOR hires x 6 months at $599 | $30,782 |
| 20 | Sign-on bonuses | 8 bonuses at $5,000 (assumption) | $40,000 |
| 21 | Compliance and verification | Audit, legal review, verification (assumption) | $15,000 |
| 22 | Contingency reserve | 10% of lines 11-20 | $57,236 |
| Total cash budget | 100 external hires | $1,350,810 | |
| Cost per hire | Total divided by 100 | $13,508 |
The table shows how lopsided a recruiting budget is once every line is priced. Two lines, recruiters and agency fees, make up almost half of the total, while the five technology lines together cost less than a single recruiter's loaded salary. The chart below groups the lines into the five blocks.
Worked 2027 Budget by Block
People account for 46% of the cash budget and per-hire costs for 33%, with technology at about 6%, attraction at about 10% and the risk lines at about 5%. Adding the shadow cost of interviewer time would raise the true cost to about $1.49 million, or $14,900 per hire, which is worth showing to leadership even though it is not cash. On a narrower, SHRM-style definition, which leaves out sign-on bonuses, background checks, immigration and employer-of-record fees, compliance and the reserve, the same budget comes to about $12,000 per hire.
That is well above a blend of SHRM's averages (not its medians), which for 95 non-executive and 5 executive hires would be about $7,000 per hire. The gap is likely to be largely structural rather than a sign of waste: SHRM's sample includes many small organizations where managers recruit for themselves, since only 55% of respondents have dedicated in-house recruiters, while this company runs a full talent team with paid sourcing seats. The lesson is to compare yourself with organizations that hire the way you do, not with the overall average.
How the total moves under three scenarios
The most useful thing a budget can do is show what happens when a decision changes. The chart below compares the baseline with two alternatives that use the same hiring plan. In the AI-leaning scenario, the company upgrades its AI sourcing tools to about $500 per user a month, drops the contract recruiter, and fills the three senior engineering roles in-house instead of through a contingency agency. In the agency-heavy scenario, it runs with two recruiters instead of three, drops the contractor and one LinkedIn seat, and sends 15 standard professional roles to contingency agencies at 20% of a $100,000 salary.
2027 Budget Under Three Scenarios
The spread between the scenarios is about $346,000, or $3,500 per hire, and almost all of it comes from channel choices rather than from tool prices. The AI-leaning budget costs about $1.17 million ($11,700 per hire) because the extra $14,400 spent on better sourcing tools replaces $135,000 of contingency fees and a $50,000 contractor, and the reserve shrinks with the agency line. The agency-heavy budget saves about $106,000 on a recruiter, $50,000 on the contractor and $11,000 on a LinkedIn seat, and still ends up at about $1.51 million ($15,100 per hire), because 15 agency placements at $20,000 each, plus the reserve that grows with them, cost far more than the capacity they replace. The AI-leaning scenario carries its own risk, which is that the in-house team takes longer to fill the hard roles, so present it with a time-to-fill assumption rather than as free money.
Copy the template into a spreadsheet
The block below is the same budget as a CSV file with live formulas. Copy it into a text file, save it with a .csv extension, and open it in Excel or import it into Google Sheets (File, Import). Change the quantity and unit cost columns to your own numbers and the totals update automatically. The formulas use 1.25 as the loaded-cost factor and 1.322 as the pound-to-dollar rate; update both if your assumptions differ.
Line,Block,Item,Quantity,Unit cost,Annual cost,Notes
1,People,Talent leadership,1,=150000*1.25,=D2*E2,"Base salary x 1.25 loaded"
2,People,Recruiters,3,=85000*1.25,=D3*E3,"Hires in-house / about 29 hires per recruiter"
3,People,Coordinators and ops,1,=52000*1.25,=D4*E4,"1 per 3-4 recruiters or by interview volume"
4,People,Flex capacity (contract hours),520,96,=D5*E5,"GSA CALC median ceiling rate about $96/hour"
5,People,Hiring-team time (shadow),1550,90,0,"Shadow cost = D6*E6; excluded from cash total"
6,Technology,Applicant tracking system,1,23000,=D7*E7,"Vendr medians, Lever to Greenhouse"
7,Technology,LinkedIn Recruiter seats,3,=8575*1.322,=D8*E8,"G-Cloud list, 3-10 seat band"
8,Technology,AI sourcing and outreach (seat-months),48,200,=D9*E9,"List prices $99-$494 per seat-month"
9,Technology,Contact data (seat-months),48,49,=D10*E10,"Apollo Basic billed annually"
10,Technology,Assessments and interview tools,1,16080,=D11*E11,"Coding platform + general skills tests"
11,Attraction,Job advertising (ad-sourced hires),40,=(36*1340+4*2795)/40,=D12*E12,"Appcast median cost per hire"
12,Attraction,Employer brand and careers site,1,=12100*1.322,=D13*E13,"LinkedIn Career Page Basic"
13,Attraction,Events and campus,1,12000,=D14*E14,"Your own event list"
14,Attraction,Referral bonuses (referral hires),17,2500,=D15*E15,"About 17% of hires from referrals"
15,Per-hire,Agency and search fees,1,=2*250000/3+3*180000*0.25,=D16*E16,"Role by role: salary x fee %"
16,Per-hire,Background checks,100,59.99,=D17*E17,"Plus court and state pass-through fees"
17,Per-hire,Candidate travel (trips),20,700,=D18*E18,"$428 airfare + $181/day per diem + ground"
18,Per-hire,Relocation (lump sums),4,12500,=D19*E19,"Just above the most common band ($10,000-$12,499)"
19,Per-hire,Immigration and EOR,1,=2*10000+18*599,=D20*E20,"H-1B petitions + EOR months at $599"
20,Per-hire,Sign-on bonuses,8,5000,=D21*E21,"Decide whether recruiting or comp owns this"
21,Risk,Compliance and verification,1,15000,=D22*E22,"Bias audit, legal review, ID checks"
22,Risk,Contingency reserve,,,=0.1*SUM(F12:F21),"10% of lines 11-20"
,,Total cash budget,,,=SUM(F2:F23),
,,External hires,,,100,
,,Cost per hire,,,=F24/F25,
A spreadsheet like this is most useful when it stays alive during the year. Add three columns next to the annual cost for actual spend to date, forecast for the rest of the year, and variance, and update them monthly from your finance system and applicant tracking system. The budget then becomes the tool you use to make mid-year decisions, such as releasing the reserve or moving a role from an agency to your own team, rather than a document filed in October and forgotten. The next section looks at the force most likely to change these numbers during 2027: AI agents.
10. How AI Agents Are Changing the 2027 Budget
AI is moving recruiting money from people and agencies toward software, but in 2026 it mostly raises recruiter capacity rather than replacing recruiters outright. For 2027 budgets, that suggests a specific move: fund AI tools from the agency and flex capacity lines first, measure the results on hard-to-fill roles, and only then revisit team size. Cutting recruiters first and hoping the tools fill the gap is how teams end up paying agencies more, not less.
The direction of travel is clear from talent leaders' own plans. Korn Ferry's survey of about 1,670 talent acquisition leaders, published in October 2025, found that 84% planned to use AI in the coming year, 52% planned to add autonomous AI agents to their teams in 2026, and 43% planned to replace some roles with AI, most often in operations and back-office work - Korn Ferry. Employ's 2025 survey found that 65% of recruiters already used AI in their workflows. And talent teams have already shrunk: an ERE analysis of BLS data found that employment of human resources specialists, a broad occupation that includes recruiters and so only a rough proxy, fell by about 5,000 jobs in 2025, the first decline since the series began in 2012 - ERE.
Four pricing models, four budget behaviors
AI recruiting products are priced in four main ways, and each one behaves differently in a budget. The pricing model matters as much as the price, because it decides whether the cost is fixed or variable, and what happens when the hiring plan changes mid-year. Most products fit cleanly into one model, although some vendors combine a subscription with usage caps or add-on fees.
The distinction matters because AI tools increasingly overlap with lines that already exist. A sourcing agent priced per seat competes with LinkedIn Recruiter seats in line 7; one priced as a success fee competes with agency fees in line 15; and an AI interviewer bundled into an applicant tracking system may make part of line 10 redundant. Budgeting each tool on the line it actually replaces is what shows whether the total cost of hiring went down, rather than simply adding another subscription to the technology block. Before signing, put each AI tool you are considering into one of the four models below and check that it sits on the right budget line.
- Per seat: a monthly or annual price per recruiter, such as Juicebox or Metaview's sourcing plans
- Monthly allowance: a fixed fee with a cap on profiles, credits or actions, such as HeroHunt.ai
- Capacity tiers: add-ons sold per license with monthly caps, such as LinkedIn Hiring Assistant
- Success fee: a percentage of salary on hire, such as Jack & Jill's Jill (10% in the UK and Europe) or Dex (20% to 30%)
Seat and allowance pricing are fixed costs that belong in the technology block, and they get cheaper per hire the more you use them. Capacity tiers are also fixed but expire monthly, so unused capacity is wasted; LinkedIn's help pages state that Hiring Assistant limits apply per license, are not pooled, and do not carry over. Success fees are variable costs that belong in the per-hire block next to agency fees, which is exactly where they compete: a 10% fee is cheaper than a 25% agency fee, but on a $150,000 hire it is still $15,000, more than the worked example spends on AI sourcing tools for the whole year. Match the pricing model to the role group: success fees can make sense for a handful of hard roles, while seat or allowance pricing wins when volume is steady.
What the evidence shows, and where it fails
The strongest evidence for AI savings comes from high-volume hiring. Chipotle's chief executive said in 2025 that its AI hiring assistant, built by Paradox, had cut time to hire by up to 75%, with applicants moving from application to ready-to-hire in about 3.5 days instead of up to 12 - CNBC via NBC Chicago. Gartner likewise identifies high-volume, low-complexity roles as having the highest potential for cost savings, while warning that "there is such a thing as too much efficiency". For professional and technical roles, most published results are vendor-reported. LinkedIn says Hiring Assistant users find interview-quality applicants 33% faster, based on its own January 2026 data - LinkedIn.
The failure modes are just as real and should shape the budget. AI on the candidate side has flooded employers with applications: Greenhouse's benchmark shows applications per job more than doubling from 116 in 2022 to 244 in 2025. Greenhouse's chief executive, Daniel Chait, calls this a "doom loop", in which candidates use AI to apply everywhere and employers use AI to screen them out, and both sides get worse results. His conversation below, published in August 2026, is the clearest explanation of why AI applied to a chaotic process just scales the chaos.
Greenhouse's Daniel Chait: Hiring Is Broken and Nobody's Winning
Chait's argument has a direct budget implication: AI tools pay off when the process underneath is structured, with clear criteria, consistent interviews and fast decisions, and they waste money when it is not. That is why the compliance and verification line sits next to every AI tool in this template, and why the hiring-team time line matters. An AI screening tool that sends twice as many candidates to interviews has increased your costs, not reduced them, even if the subscription looks cheap.
How to budget for AI in 2027
The practical approach is to treat AI as a funded experiment with a clear success metric rather than as a line you hope will pay for itself. Start by identifying the roles that cost the most per hire, usually the hard technical roles and anything that tends to end up with an agency. Fund AI sourcing or agent tools for those roles from the agency and flex capacity budget, run them for one or two quarters on monthly or short-term terms where possible, and compare the cost per hire and time to shortlist with the previous year.
If the pilot works, the second step is to adjust capacity assumptions rather than cut people. Raise the hires-per-recruiter assumption in line 2 from, say, 29 to 35 for the role groups where the tools proved themselves, and let the 2028 budget reflect the lower headcount need through attrition. If it does not, you have spent one or two quarters of tool subscriptions rather than a recruiter's salary. Either way, the budget should record which AI tools influence decisions about candidates, because the 2027 rules in California and Colorado, and the EU's high-risk obligations from December 2027, attach duties to exactly those tools, and you cannot meet them without knowing which ones you use.
11. How Recruiting Budgets Fail, and How to Defend Yours
Recruiting budgets rarely fail because a price was wrong; they fail because the plan changed and the budget had no mechanism to change with it. The most common failures are predictable, which means they can be designed out at budget time. The goal is a budget that bends without breaking: one where finance can see what each dollar buys, and where talent acquisition has agreed rules for what happens when the plan moves.
Most failures trace back to one of a handful of root causes. Each is easy to spot in hindsight and easy to prevent with a single rule written into the budget before the year starts. The list below covers the ones that come up most often in practice.
- Backfills left out: the budget covers new roles only, and replacement hiring arrives unfunded
- Agency creep: roles drift to agencies one exception at a time, without a rule or an owner
- Stranded fixed costs: seats renew for tools nobody uses, or a freeze leaves recruiters idle
- Cost per hire alone: judging only on cost, where cheap hires that fail, or slow hires that delay revenue, look like savings
The first two are the most expensive. Missing backfills is a planning error that section 2 fixes with a simple formula. Agency creep is a governance error: in the worked example, sending just five roles to agencies costs more than all five technology lines and the attraction block combined, so every agency engagement needs an owner, a reason and a cap. Unused seats and idle capacity are timing problems, solved by quarterly license reviews and by preferring monthly or shorter terms for tools whose value is unproven. The last failure is the subtlest: SHRM's 2025 data shows that only 20% of organizations measure quality of hire, which means most recruiting budgets are judged on cost and speed alone.
Rules that keep the budget honest
The best defense is a small set of rules agreed with finance before the year starts, so that mid-year decisions are applications of a rule rather than fresh negotiations. The diagram below shows one such rule set for a role that is not filling on plan: it moves from advertising to sourcing to an approved agency engagement, with the reserve as the funding source of last resort.
The diagram encodes three budget decisions. Advertising budgets do not rise automatically when a role is slow; the role moves to a different channel instead. Agencies are a deliberate choice for business-critical roles, with a named approver, rather than the default for anything hard. And roles that are neither filling nor critical get re-scoped or delayed, which is often the right answer and the one budgets without rules never reach.
Beyond escalation, three other rules prevent most mid-year disputes. A freeze protocol states in advance which fixed costs are cut first if hiring stops, typically contract recruiters, then unused seats at renewal, then open recruiter roles, so that a freeze does not strand the whole people block. A quarterly license review compares the seats you pay for with the seats used in the last 30 days and cancels or reassigns the difference at the next renewal. And the reserve rule from line 22 names who can release the contingency, and for what.
The rules also make the budget easier to defend upward. When a business leader asks for a hire that is not in the plan, the conversation is no longer about whether recruiting has money left; it becomes a calculation of what the role will cost through each channel and which line, or the reserve, will fund it. Talent leaders who run their budgets this way spend less time justifying spend, because the logic was agreed before the year began.
Presenting the budget to finance
When you present the budget, lead with the hiring plan, not the spend. Show the number of hires by role group, the channel assigned to each group, and the resulting cost per hire, then the total. Present at least three scenarios, as in section 9, so that finance can see what a 20% cut buys and what it costs in hires or time. Finance teams are used to driver-based plans, and a recruiting budget built the same way gets a better hearing than one presented as a list of tools and vendors.
The worked example shows how this plays out. In the 100-hire budget from section 9, a 20% cut means finding about $270,000. Moving the five agency placements in-house would more than cover it on paper, at the price of longer time to fill on those roles; cutting a recruiter saves about $106,000 but removes roughly 30 hires of capacity, which then have to be dropped from the plan or sent to agencies. Putting the options side by side turns a budget cut from a negotiation over talent acquisition's spending into a business decision about which hires matter most.
Then agree how the budget will be tracked. A monthly report with actual spend, open roles, hires made and cost per hire by role group is enough for most companies, with a quarterly reforecast that updates the hiring plan and moves money between lines. If you report quality alongside cost, for example the share of hires still employed and performing well after six months, you protect the budget from the argument that cheaper is always better. The final section turns all of this into a decision framework.
12. The Bottom Line: A Decision Framework
A good 2027 recruiting budget starts with the hiring plan, assigns a channel to every group of roles, prices 22 lines from real data, and keeps a reserve and a set of rules for when the plan changes. The numbers in this guide give you a defensible first draft: about 29 hires per recruiter a year, a loaded cost factor of about 1.25, roughly $1,340 of advertising per ad-sourced hire, 20% to 33% of first-year pay for each agency placement, and a 10% reserve on variable lines. For the worked 100-hire company, that adds up to about $1.35 million, or $13,500 per hire, with a range of roughly $11,700 to $15,100 per hire depending on how much work goes to agencies.
How you apply the template depends mostly on how many people you hire and what kind of roles they are. Companies making fewer than about 30 hires a year usually should not build a full talent team yet: a talent leader or senior recruiter, a lean applicant tracking system, an AI sourcing tool and a strict rule for when an agency is allowed will cover most plans. Companies making 30 to 150 hires should size their recruiters at roughly 25 to 30 hires each, keep agencies for executive and genuinely critical roles, and give every recruiter on hard roles an AI sourcing tool. Companies making more than 150 hires need coordinators and recruiting operations, should consider RPO or contract recruiters for peaks, and can negotiate multi-year terms on their core tools.
Role mix matters as much as volume. Volume-heavy plans should spend on advertising, automation and coordinators, where Gartner and the Chipotle results suggest AI produces its clearest savings. Hard and technical plans should spend on sourcing tools and interviewer time, and protect the agency line with escalation rules. And every plan should keep its compliance line in 2027, because the AI rules taking effect in California and Colorado, with the EU following in December, apply to the tools many of these budgets are now buying. For teams whose hardest roles are drifting toward agencies, an AI recruiter such as HeroHunt.ai is one way to bring that sourcing in-house at a fixed monthly cost.
AI sourcing, screening and outreach for a flat monthly price with unlimited positions, and no placement fee when you hire.
This guide reflects recruiting costs, vendor prices and regulations as of October 2026. Prices change frequently, negotiated medians vary with company size and contract terms, and immigration rules in particular are in flux, so verify current figures with each vendor and your advisers before finalizing your 2027 budget.