



The 2026 stage-by-stage benchmarks for every step of the recruiting funnel, from job ad to accepted offer, rebuilt from the primary datasets instead of the listicles that quote them.
In the Greenhouse, Gem and Ashby datasets, it now takes roughly 200 to 300 applications to make one hire. Greenhouse measured 203 applications per hire across more than 6,000 North American employers in 2025 - Greenhouse. Ashby customers needed 291 applications per hire in the first quarter of 2026, against roughly 100 in early 2021 - Ashby. Gem put it most bluntly: only one in 200 applicants ultimately secures a role - Gem.
But here is the problem: the funnel did not get worse everywhere, and most teams are fixing the wrong stage. Most of the damage happened in the top half of the funnel. The share of applications that reach a first real conversation has roughly halved since 2021, while the offer stage held up far better. Offer acceptance sits between 81% and 84% in the current Gem, Ashby and Employ datasets. In Ashby's data, interview-to-offer rates for business roles now beat their 2021 level, although Gem's onsite-to-offer rate (39%) is still below its 2021 level of 47%. A team that grades its 2026 screen rate against a 2021 benchmark will conclude its process is broken when it is simply flooded.
This guide sets out the real 2026 conversion rate for each stage: ad to application, application to screen, screen to interview, interview to offer, and offer to acceptance, plus the outbound funnel from first message to hire and the agency funnel from submittal to placement. It breaks each number down by source, role, company size, industry and region, explains why published benchmarks disagree by a factor of four or more, and shows how AI agents are changing each stage. Every figure names its dataset, its population and its period, because a conversion rate without its denominator is not a benchmark.
Written by Yuma Heymans (@yumahey), founder of HeroHunt.ai, whose AI Recruiter sources and contacts candidates across more than a billion profiles for 15,000+ recruiters. Building an outbound engine means living inside these ratios every day, especially the ones nobody publishes.
Contents
- The 2026 Recruiting Funnel at a Glance
- Why Published Funnel Benchmarks Disagree
- Stage 1: Job Ad to Application
- Stage 2: Application to First Screen
- Stage 3: Screen to Interview and Onsite
- Stage 4: Interview to Offer
- Stage 5: Offer to Acceptance
- The Outbound Funnel: From First Message to Hire
- Conversion by Source: Referrals, Inbound, Agencies and Internal
- Benchmarks by Role, Industry, Company Size and Region
- Time in the Funnel: Speed Benchmarks by Stage
- The Agency Funnel: Submittals, Interviews and Placements
- How AI Is Changing Funnel Conversion in 2026
- Where Funnel Optimization Fails
- How to Benchmark and Plan Your Own Funnel
- Future Outlook: The Funnel in 2027
- Conclusion: Which Benchmark to Use, and When
1. The 2026 Recruiting Funnel at a Glance
The typical 2026 funnel turns 1,000 applications into about five hires, and it loses more than 90% of them at the very first gate. That is the single most useful number in this guide, and it comes from one consistent dataset rather than a stitched-together composite. In Gem's June 2024 to May 2025 data, 8% of applications reached a pre-onsite stage such as a recruiter screen, 19% of those reached an onsite, 39% of onsites produced an offer and 82% of offers were accepted - Gem. Multiply those four rates and you get the 0.5% application-to-hire rate Gem reports, which is why it is a trustworthy reference chain.
The shape matters more than the end number. The first cut removes 92% of applicants, the middle of the funnel removes most of the rest, and the offer stage barely loses anyone. Gem's own trend line shows where the change happened: the application-to-pre-onsite rate fell from 13% in 2021 to 8%, pre-onsite-to-onsite fell from 30% to 19% and onsite-to-offer slipped from 47% to 39%, while offer acceptance edged up from 81% to 82%. The funnel narrowed mostly at the mouth, not at the bottom, and every benchmark in the rest of this guide should be read through that lens.
The diagram shows why "improve our conversion rate" is too vague to act on. Of the 995 applicants who do not become hires, 920 are lost before anyone on the hiring team speaks to them. If your team wants more hires from the same pipeline, the first gate is where the volume lives, and the offer stage is where the value per candidate is highest. Those are different problems with different fixes: one is a screening capacity problem, the other is a closing problem.
The table below collects the most defensible 2026 benchmark for each stage, the spread you will see across credible datasets, and the source to cite. Each row names a rate between two specific events, because a "screen rate" measured from applications is a different number from one measured from candidates who were contacted. Use the typical value as your planning default and the range as your sanity check.
| Stage (from → to) | Typical 2026 rate | Credible range | Best current source |
|---|---|---|---|
| Job ad click → application | 4.7-5.2% | 3.2% (healthcare) to 7.1% (tech); easy apply ~21% (Joveo) | Appcast, Joveo, 2025 data |
| Application → first screen | 8% | 6% (inbound) to 86% (sourced) | Gem, Jun 2024-May 2025 |
| Application → interview | 3.6-4.7% | 3.6% (technical) to 6.7% (EMEA) | Ashby, 2026 |
| First screen → onsite | 19-35% | 16% (inbound, Gem) to 52% (referrals, Ashby) | Gem, Ashby |
| Onsite → offer | 24-39% | 22% (outbound) to 43% (customer success) | Gem, Ashby |
| Offer → accepted | 81-84% | 67% (IT services, Gem) to 91% (manufacturing, Employ) | Gem, Ashby, Employ |
| Application → hire | 0.3-0.5% | 0.1% (data science) to 1.4% (manufacturing) | Gem, Greenhouse |
Why this matters: the table is only useful if you compare like with like. Your own "screen rate" should be measured from the same starting event as the benchmark, over a comparable period, and ideally on a similar mix of roles. A technical team that sees 3% of applications reach an interview is not underperforming, because Ashby measured exactly 3.6% for technical roles in Q1 2026. A sales team seeing the same 3% more likely has a screening or sourcing problem, because Ashby's business roles reached 4.7% in the same quarter, and in Gem's data sales funnels convert almost four times better end to end than technical ones.
How to apply this: pull your last two quarters of stage data from your ATS, compute each stage-to-stage rate using the same boundaries as the table, and mark any stage more than about a third below the typical value. Then check whether that stage is also where your volume is concentrated. A weak stage with little volume is a curiosity; a weak first gate with thousands of applicants behind it is where the next hires are hiding. The rest of this guide walks through each stage in that order, starting with why the published numbers disagree so much in the first place.
2. Why Published Funnel Benchmarks Disagree
Published funnel benchmarks disagree mainly because they use different denominators and different customer bases, not because the market differs that much. One vendor reports applications per hire, another applications per job, a third applicants per opening, and a fourth a median instead of a mean. Put side by side without those labels, the numbers look like they describe different planets. With the labels, most of the disagreement disappears and a consistent picture emerges.
The clearest example is applications per hire. SmartRecruiters reports 73 applicants per role on its enterprise-heavy customer base, a figure its own scorecards treat as per hire (September 2023 to August 2024 data, republished in its 2026 edition) - SmartRecruiters. Pinpoint reports a median of 76 for Q2 2026 - Pinpoint. CareerPlug, whose customers are mostly small businesses hiring hourly staff, measured 180 applicants per hire in 2024 - CareerPlug.
Workable's last published figure was 181.2 candidates per hire for September 2024 - Workable. Greenhouse sits at 203 and Ashby at 291. That is a fourfold spread for what sounds like the same metric.
Applications per hire, by dataset
The chart is not a ranking of which employers hire more efficiently. It mostly reflects who each vendor's customers are and how each one counts. Ashby's base skews toward venture-backed technology companies with remote-friendly roles that attract global inbound volume. SmartRecruiters skews toward large employers with frontline and hourly roles, where many candidates apply to a local job they can actually do. Pinpoint reports a median, while Ashby reports an average (Greenhouse does not say which it uses), and the distribution is heavily skewed: in Pinpoint's own Q2 2026 data the 25th percentile is 30 applicants per hire and the 90th percentile is 458. A mean pulled up by a few viral postings will always sit far above the median.
Denominators create the second layer of confusion. Greenhouse reports 244 applications per job alongside its 203 per hire, and Employ reports 257.5 applications per job across 6,640 customers on Jobvite, Lever and JazzHR - Employ. iCIMS measures only about 30 applicants per opening in the US in August 2026 - iCIMS. Per job, per opening and per hire are three different things. A job can have several openings, and many jobs close without any hire at all: Greenhouse found only 69.8% of jobs closed with a hire in 2025.
The table below lists the datasets used throughout this guide, so you can see at a glance which ones fit your situation. The most important columns are the customer base and the period, because a 2026 benchmark built on 2023 data or on a customer base unlike yours will mislead you no matter how large the sample.
| Publisher | Dataset | Period | Customer base | Headline metric |
|---|---|---|---|---|
| Gem | 165M applications, 1.2M hires | Jun 2021-May 2025 | Gem customers, startup to enterprise | 0.5% application to hire |
| Ashby | 109M applications, 247K jobs | Jan 2021-Mar 2026 | Venture-backed and tech-heavy | 291 applications per hire |
| Greenhouse | 640M+ applications, 6,000+ orgs | 2022-2025 | North American employers | 203 applications per hire |
| Employ | 6,640 customers (Jobvite, Lever, JazzHR) | 2025 | Broad, SMB to enterprise | 257.5 applications per job |
| SmartRecruiters | 89M applications, 1.5M jobs | Sep 2023-Aug 2024 | Enterprise and frontline | 73 applicants per hire |
| Appcast | 302M clicks, 27.4M applies | 2025 | ~1,200 US employers buying job ads | 5.19% apply rate |
Two more traps catch experienced analysts. First, stage rates do not multiply into a funnel unless they come from the same candidates. Appcast publishes a median for each stage of its paid-traffic funnel, and multiplying those medians implies about 36 applications and roughly $690 per hire, while the same disposition funnel reports a median cost per hire of $1,053 - Appcast. Employ's four stage averages chain to roughly 94 applications per hire, against the 257.5 applications per job it measures directly. Medians of separate stages describe separate populations, so the chain is fiction.
Second, even primary reports contain errors, so audit before quoting. Greenhouse's North America PDF prints 56.7 days to fill, but its own benchmarks page lists 59.67 days and the stated 36.8% increase from 43.64 days only works with 59.7 - Greenhouse. The same report labels 746 applications per recruiter as annual, although the arithmetic only reconciles as a monthly figure. Greenhouse's "Stage 1" and "Stage 2" progression rates are real measurements, but the report never defines which stages they are. Statistics trackers such as the AIRecruiter.co statistics index help by linking each figure back to its primary report, which is exactly the habit worth adopting.
Why this matters: most "our funnel is below benchmark" conversations are really denominator mismatches. How to apply this: before you compare, write down four things for any benchmark you use: the start and end event, mean or median, the data period, and the customer base. If any of the four does not match your own measurement, either find a closer benchmark or adjust your expectation explicitly. With that discipline in place, the stage-by-stage numbers below become genuinely comparable, starting with the very top of the funnel.
3. Stage 1: Job Ad to Application
About 5% of job-ad clicks become a completed application, and that rate is the most controllable number in the whole funnel. Appcast's 2026 benchmark report, built on 302 million clicks and 27.4 million applications from nearly 1,200 US employers, found the median apply rate on standard ATS-based applications ended 2025 at 5.19% - Appcast. Its separate candidate-disposition dataset put the median click-to-apply conversion at 4.66%. Both measure completed applications divided by clicks on a paid job ad, not by views or impressions.
That denominator detail is why "apply rate" is really three different numbers in circulation. Appcast and Joveo divide by paid-ad clicks. CareerPlug divides by job-posting views, and found 4.7% of views turned into applications across small businesses in 2024, ranging from 2.6% in fitness to 13.8% in hospitality and entertainment - CareerPlug. Career-site conversion is different again: in Tellent Recruitee's 2024 data, fewer than 5% of visitors applied in the Benelux and DACH regions, against 10.4% in France and 11.6% elsewhere, and 41.2% of started applications were abandoned - Recruitee.
Occupation shapes the rate more than most employers expect. In Appcast's 2025 data, technology roles had the highest median apply rate at 7.14%, up almost 14% on 2024 as laid-off tech workers applied more widely. Business and consumer services (7.02%) and HR and staffing (6.91%) came next, while hospitality sat at 4.85%, education at 3.94% and healthcare lowest at 3.22%. White-collar "sitting-down" roles such as legal (up almost 18%) and finance (up about 14%) rose the most year over year, and frontline healthcare, hospitality and education fell. A healthcare recruiter who benchmarks against a tech apply rate will chase a number the market will not give them.
Application length is the biggest lever inside your control, and the data on it is unusually consistent. Joveo's 2025 paid-advertising data shows the apply rate falling with every page added to the form - Joveo. The steepest cliff sits between a two-page and a three-page application, where the rate drops 59%. Appcast finds the same shape measured in minutes rather than pages.
| Application format | Apply rate (completed applications per click, 2025) |
|---|---|
| Easy apply | 21.5% |
| One-page form | 12.6% |
| Two-page form | 9.7% |
| Three-page form | 4.0% |
| Four-page form | 2.5% |
| Five or more pages | 1.8% |
Read those numbers as a warning as well as an opportunity. Cutting a form from three pages to two can more than double the number of applications from the same ad spend, and Appcast's data confirms that applications taking one to five minutes convert at 5.37% against 3.09% for those taking sixteen minutes or more. But easy apply's 20% rates produce the flood that clogs the next stage, and Joveo found that for software developer roles easy apply cut cost per application to as low as $3, against nearly $40 for forms of five or more pages. A cheaper application is not a cheaper hire if nobody can screen it, so the right form length depends on how much screening capacity sits behind it.
Content and timing matter at the margin. Job ads that disclosed pay converted at 5.03% versus 4.51% without it in 2025, an 11.5% relative lift that grew from about 4% in 2024. Titles of four to six words converted best at 4.80%, and titles of thirteen words or more worst at 3.83%. Freshness matters even more: 53% of all applications a job ad will ever receive arrive in its first ten days, and only about 2.8% arrive between days 51 and 60. Mobile produced 63% of clicks but 71% of applications in Appcast's 2025 data, so mobile visitors actually converted better than desktop ones.
Cost per stage shows why attraction is no longer the bottleneck. Appcast's median cost per application was $19.32 at the end of 2025 and its median advertising cost per hire $1,340 as of October 2025 (the latest month it reports), both higher than a year earlier despite a softer labor market. Technology is the cautionary tale: the highest apply rate of any occupation, an ordinary cost per application of $15.55, and yet a median ad-spend cost per hire of $2,795, more than double its 2024 level of $1,364. More applicants did not make hiring cheaper, because the cost moved downstream into screening. One edition-level caution: Appcast's 2025 report, built on 1,300+ employers, said apply rates ended 2024 at 6.1% - Appcast 2025. The 2026 edition uses a different set of nearly 1,200 employers, and its own series shows late 2024 below 5% and rising through 2025, so the apparent drop to 5.19% is a dataset change, not a market decline.
Who applies has also changed. In May 2026, 30% of applications to entry-level postings on Indeed came from workers with ten or more years of experience, the largest share of any experience group - Indeed Hiring Lab. The chart below shows that applicants with 10+ years of experience are the largest group at every posting level, which is one reason screeners now spend more time rejecting overqualified and mismatched candidates.
Who applies to each level of job posting
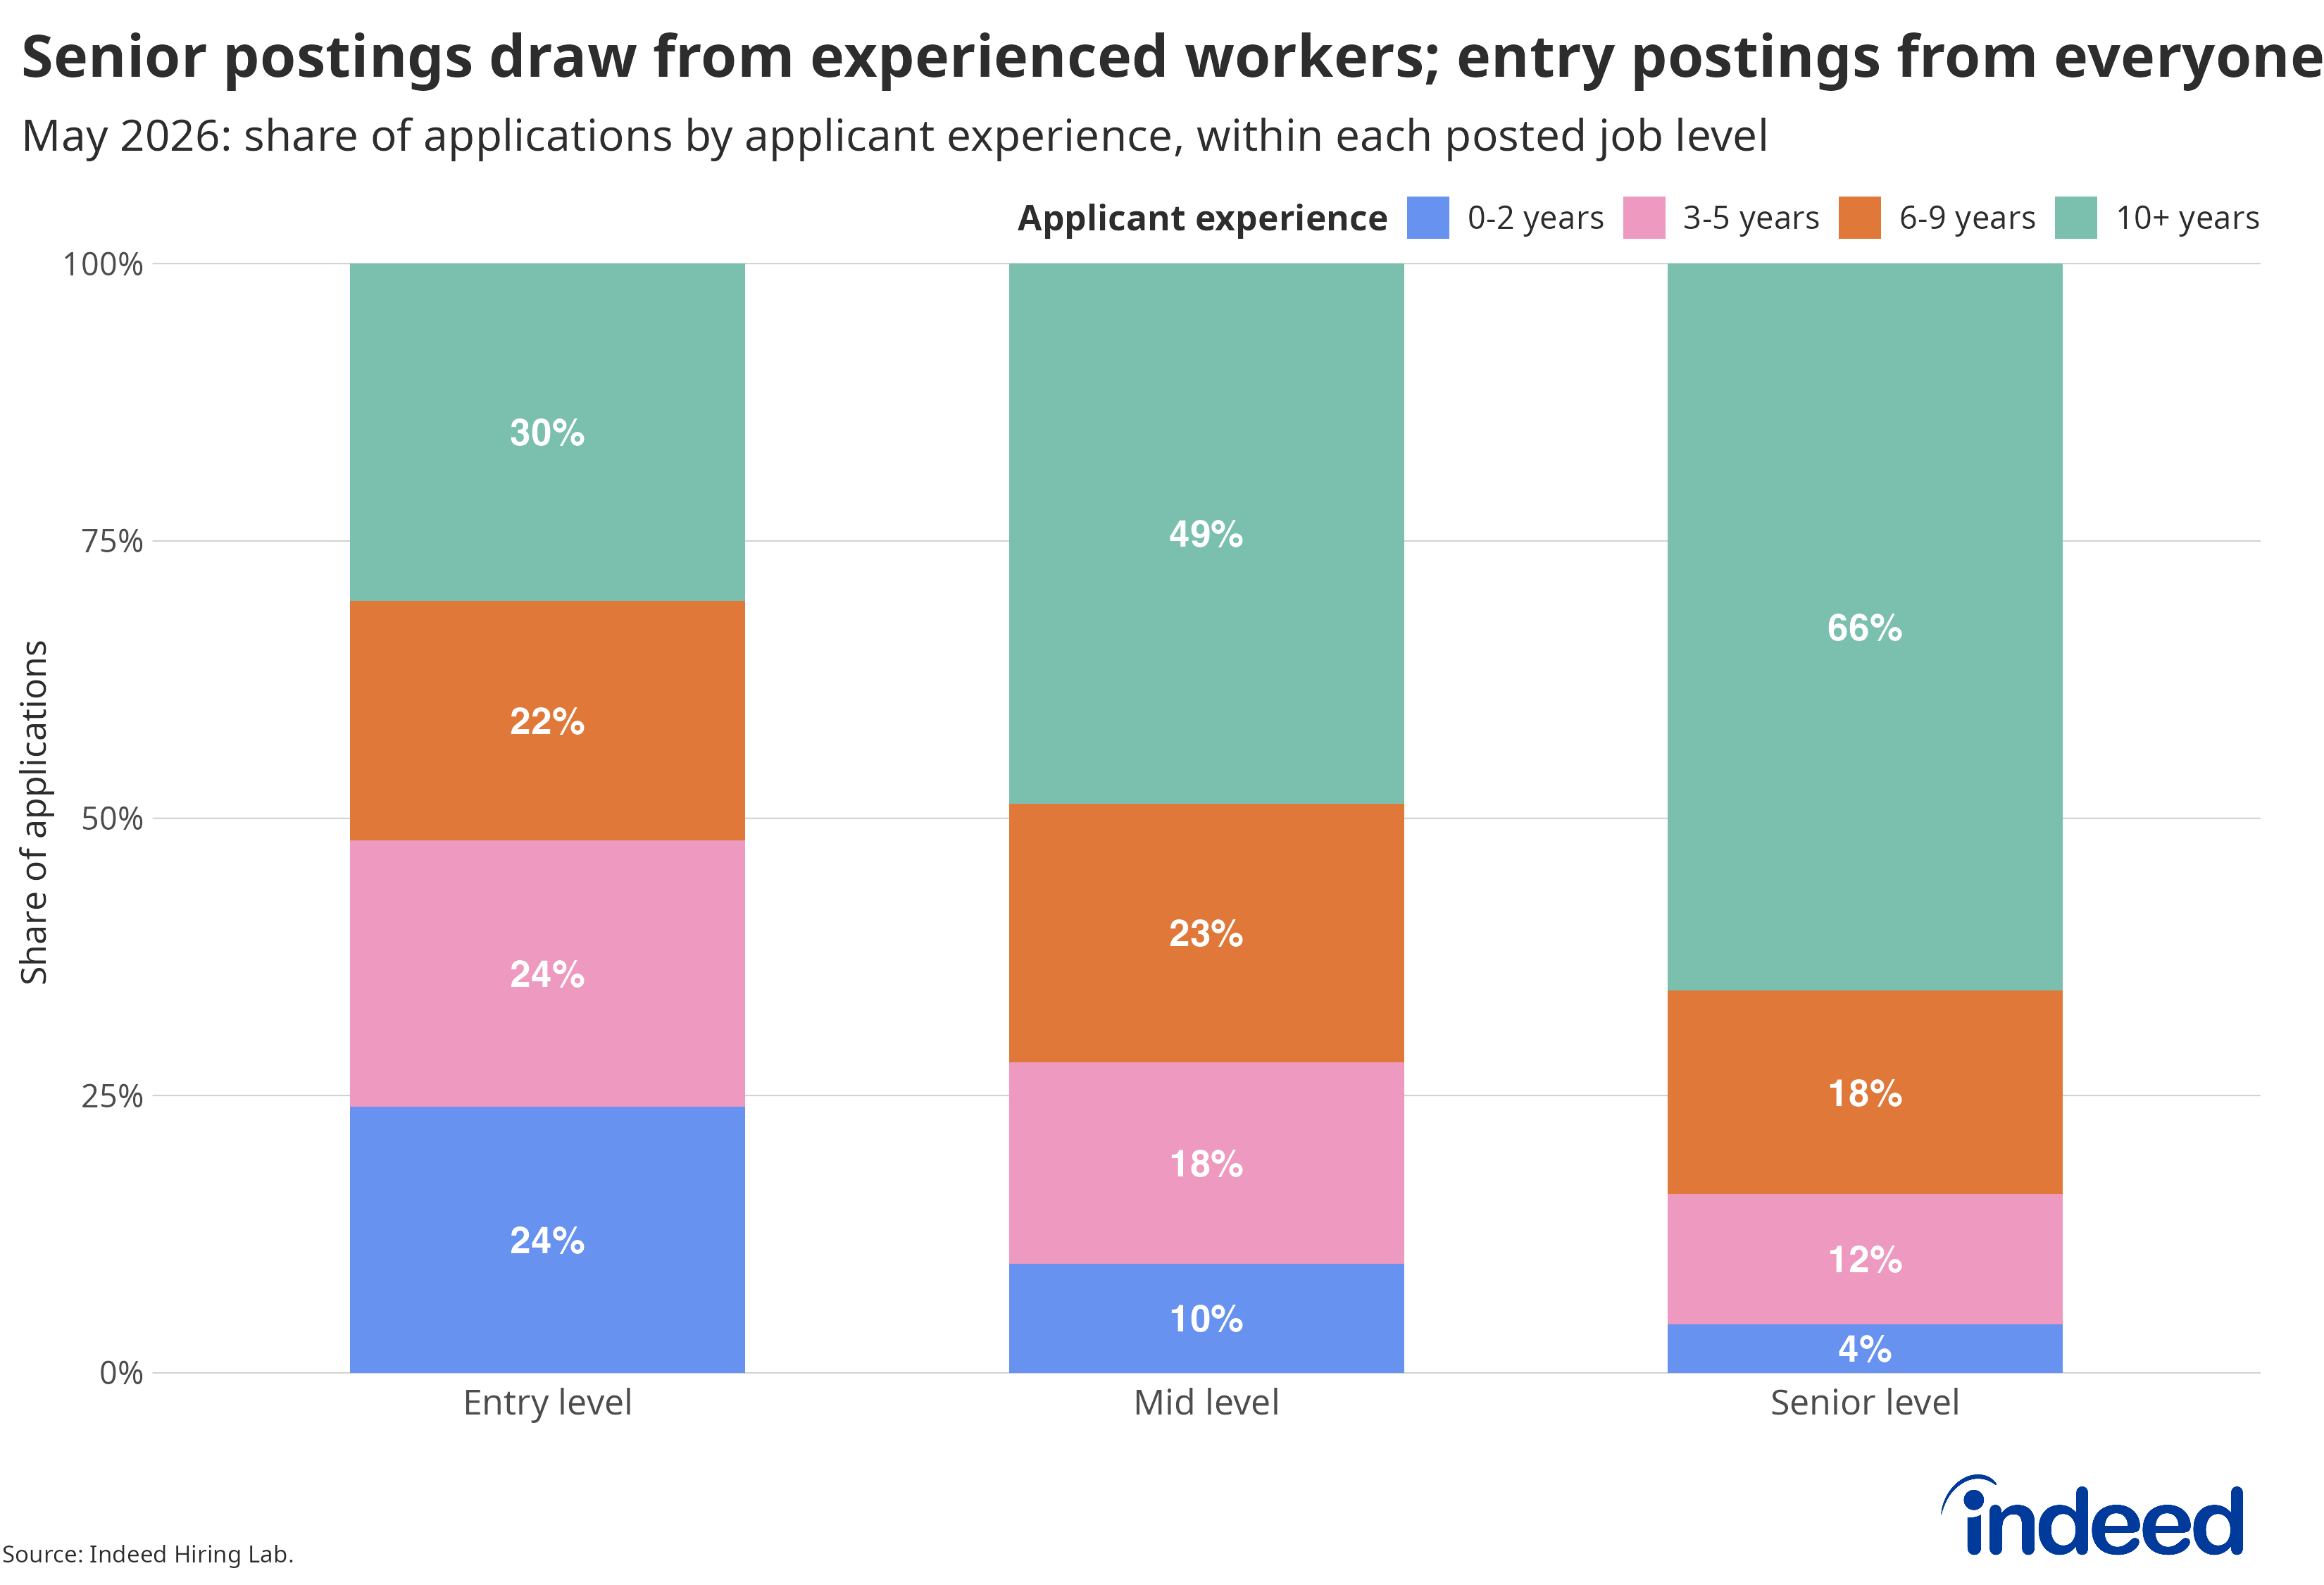
The rightmost bar is expected: senior postings draw senior applicants. The leftmost bar is the surprise, with the 10+ years group sending 30% of entry-level applications, more than any less experienced band. For the funnel, that means entry-level applicant pools are bigger and more mixed than the posting intends, which depresses the application-to-screen rate without any change in the quality of the job ad.
Why this matters: the top of the funnel is the only stage where you control almost every input (form length, pay disclosure, title, posting freshness, channel), so small changes compound through everything downstream. How to apply this: measure apply rate from a fixed denominator (clicks or views, not both), keep long-apply forms to two pages or less for roles you can screen at scale, disclose pay, refresh postings instead of leaving them live for months, and only switch on easy apply where you have screening capacity or automation to absorb the extra volume. Which brings us to the stage that absorbs it.
4. Stage 2: Application to First Screen
The first screen is the new bottleneck of the 2026 funnel: only about 4-8% of applications now reach a first human conversation in the Ashby and Gem data, roughly half the 2021 rate. At Ashby customers, 3.6% of applications for technical roles and 4.7% for business roles resulted in an interview in Q1 2026, against about 7-8% in 2021 - Ashby. In Gem's data, 8% of all applications and just 6% of inbound applications reached a pre-onsite stage in the year to May 2025, down from 13% and 11% in 2021.
Other large datasets land in the same range once you account for how they define the stage. Employ's "qualified applicant rate", the share of applicants who advance from application to screening, was 11.5% in 2025, ranging from 14.5% at enterprises to 8.3% at mid-market companies and only about 5% in software and tech - Employ. SmartRecruiters' average role drew 73 applicants, interviewed 3 and made 1 offer in its September 2023 to August 2024 data - SmartRecruiters. CareerPlug's small businesses invited 3% of applicants to interview in 2024. Appcast's paid-traffic disposition data is the outlier at 14.98% of applications reaching a screen, and like all of its stage figures it is a median across employers rather than a pooled rate.
Volume is the main reason the rate collapsed. Greenhouse customers received 244 applications per job in 2025, up 111% from roughly 115 in 2022, while recruiters per organization fell 56% and applications per recruiter rose more than 400% - Greenhouse. Gem's recruiters handled 5,327 applications a year each in the year to May 2025, up 93% since 2021, while carrying 13.4 open requisitions at a time. When the number of applicants doubles and the number of screening slots does not, the pass rate at the first gate has to halve.
The top tightened, the bottom held
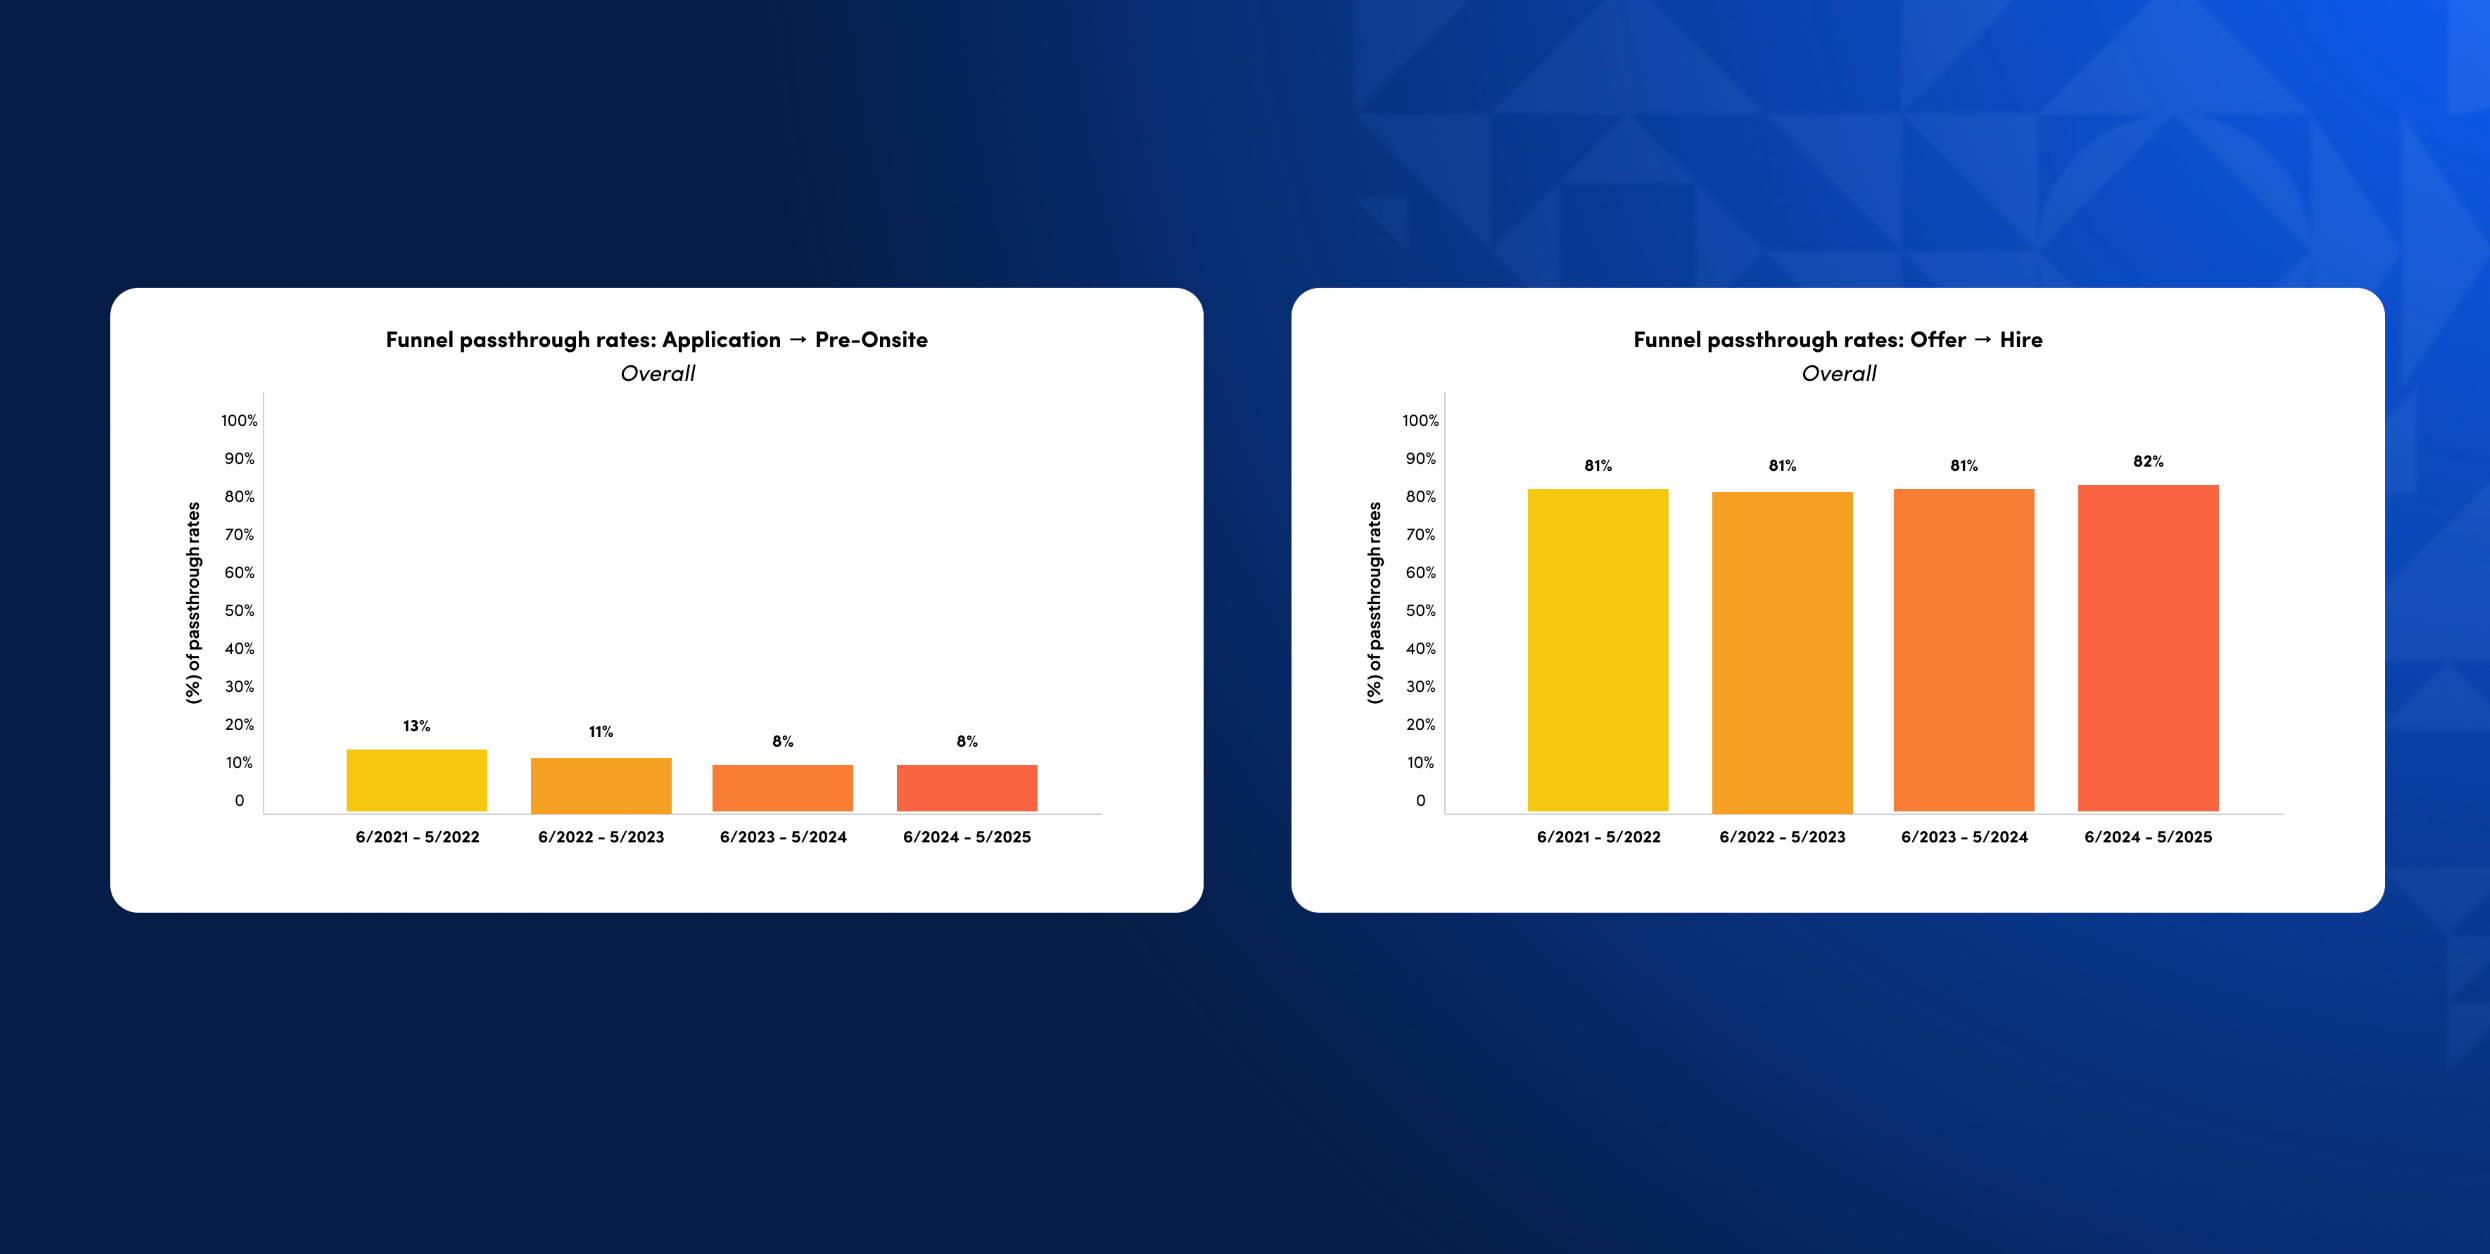
The two panels tell the story of the whole decade in one picture. On the left, the share of applicants reaching a pre-onsite stage drops from 13% to 11% to 8% and then stays there. On the right, the share of offers that convert to hires sits flat at 81% for three years and ticks up to 82%. Nothing about the closing stage got harder; the screening stage simply absorbed a volume shock.
AI on the candidate side is a large part of that shock. In Greenhouse's mid-2025 survey, 22% of US job seekers said they use AI agents to submit applications on their behalf - Greenhouse. In its November 2025 survey, 49% of US job seekers said they were submitting more applications than a year earlier, and about four in ten admitted using prompt injection, hidden text designed to game AI screening filters. These are survey answers, not measured funnel data, but they explain why the first screen now spends so much of its time on applications that were never really aimed at the role.
AI-written applications also erase the signal screeners used to rely on. When Freelancer.com launched a one-click AI cover-letter writer, the link between how tailored a cover letter was and whether the applicant got a callback fell 51%, and its link to getting an offer fell 79%, as employers shifted weight to past work history instead - Cui, Dias and Ye. When every application reads as tailored, tailoring stops predicting anything, and screeners have to find a new basis for the first cut.
Fraud is now a measurable slice of the first-screen workload, especially for remote technical roles. Since Greenhouse's Real Talent verification product became generally available in February 2026, it has run more than 10.2 million checks, flagged one in four candidates for review and failed one in 33 at identity verification outright - PR Newswire. A flag is not proof of fraud, but about 3% of checked candidates at participating employers failed identity verification outright. Gartner's widely quoted figure is a prediction rather than a measurement: by 2028, it expects one in four candidate profiles worldwide to be fake - Gartner. Our guide to detecting AI interview cheating covers the later-stage version of the same problem.
Employers have responded by automating the screen, with mixed confidence. In Greenhouse's November 2025 survey, 53% of US recruiters said they had handed most screening to AI or ATS systems - Greenhouse.
Confidence in that automation is low: only 21% of US recruiters were very confident those systems were not rejecting qualified candidates, and 34% said they spend up to half their week filtering spam and junk applications - Greenhouse newsroom. Speed at this stage is still measured in days: Employ customers took 7.2 days on average from application to first screening interview in 2025, down from 8.3 days in 2024.
Greenhouse's own podcast with recruiting analyst Tim Sackett is a good companion to these numbers. It walks through the findings of the first Hire Standard benchmark report, where TA teams struggle, and how leaders can use benchmark data to argue for change.
The hiring gap: What the numbers tell us about TA today
The data behind that discussion points to a practical conclusion: volume is not the enemy by itself, but untriaged volume is. A first screen run as a capacity-planning problem, with explicit service levels for time to first review, protects the candidates worth hiring from being buried under the ones who were never a fit.
Why this matters: a falling application-to-screen rate is now the normal state of the market, not a sign of a broken process, and it is where most of your recruiters' hours disappear. How to apply this: benchmark this stage only against 2025-2026 data, track time to first review alongside the pass rate, add knock-out questions and verification before the human screen rather than after it, and create separate lanes for referrals and sourced candidates so they are not buried in the inbound queue. The candidates who survive this gate then face the stage where hiring teams spend most of their time.
5. Stage 3: Screen to Interview and Onsite
Once a candidate clears the first screen, their odds improve sharply: roughly one in three screened candidates reaches the hiring team's main interview loop. Ashby measured a 35% passthrough rate at the recruiter-screen stage across 54 million applications and 93,000 jobs from January 2021 to March 2026, and a 24% passthrough at the onsite stage that follows - Ashby. Employ found 34.9% of screened candidates advanced to an interview in 2025, down from 38.9% in 2024. Gem's stricter definition, from any pre-onsite stage all the way to onsite, gives 19% overall and 16% for inbound candidates.
The spread between 19% and 35% is mostly definitional. Gem's "pre-onsite" bucket spans every step between application review and the onsite loop, so a candidate has to clear every pre-onsite step the company runs (such as a recruiter screen, a hiring-manager screen or an assessment) before counting as a pass. Ashby's 35% measures passthrough from a single stage group that each customer configures, so it can sit closer to one step than to the whole pre-onsite journey. Source moves it as well: 52% of referred candidates pass Ashby's initial screens, against 35% overall - Ashby. Appcast's paid-traffic median is higher again at 61.33% of screened candidates reaching an interview, and like its other stage figures it is a median across employers.
The chart below comes straight from Ashby's 2026 operations report and shows the key shape of the middle funnel: the early stages pass a minority of candidates, while the stages after the onsite pass almost everyone. The bars are stage-to-stage rates among candidates who entered each stage, not shares of all applicants.
Passthrough rates rise in the later stages
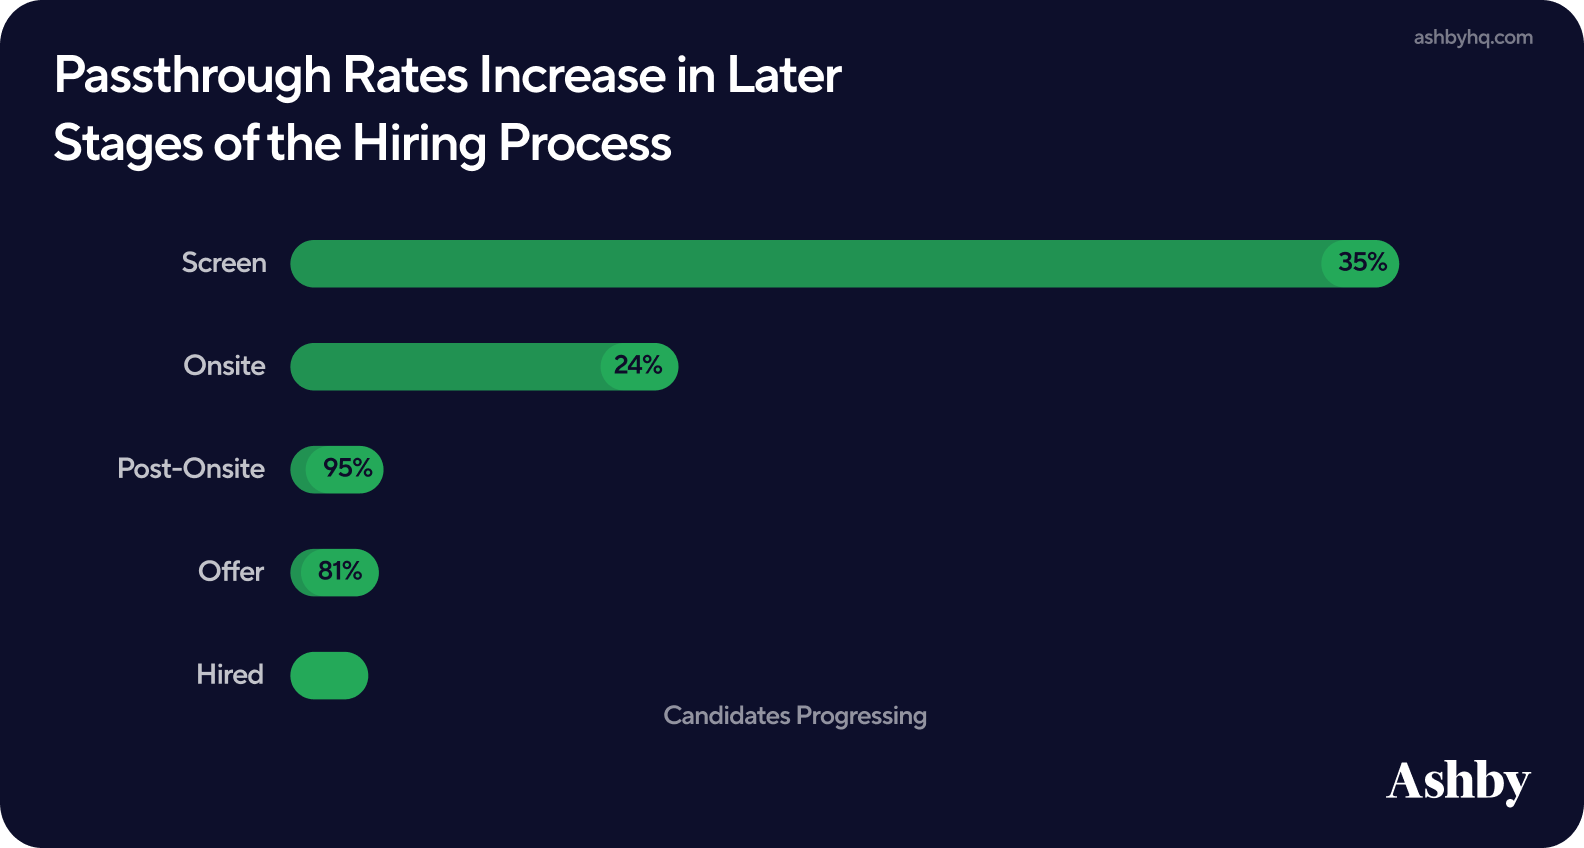
Two numbers in that chart deserve attention. The 24% onsite passthrough is the hardest gate after the first screen: three out of four candidates who reach the full interview loop are rejected or withdraw there. The 95% post-onsite passthrough shows that once a hiring team has decided, the reference checks, approvals and final conversations almost never change the outcome. That makes the onsite loop the expensive stage, because it is both selective and labor-intensive.
The interview workload per hire has grown steadily. Ashby customers now interview 17.6 applicants per technical hire and 11.7 per business hire, up 52% and 36% since 2021, with data roles highest at 19.5 and customer support lowest at 9.5. Gem counts every interview conducted, not just distinct candidates, and finds about 20 interviews per hire, up 33% since 2021, rising to 36.1 interviews and 25.6 interviewer hours per technical hire against 19.6 interviews and 11.6 hours for non-technical roles. Greenhouse reports 22.7 interviews per job and 12.3 interview hours per hire in 2025.
The candidate's own experience has not grown with it. Ashby's hired business candidates spend about 2.4 hours in interviews across four events, and technical hires about 3.5 hours across five, and both figures have been flat since 2021. The extra interviews per hire are spent on candidates who do not get the job. The loop itself also takes time: hired technical candidates wait a median 17.9 days from first to last interview, against 14.4 days for business roles, and automated scheduling confirms an interview in a median 3.7 hours against 5 hours when scheduled manually.
Company size flips the shape of this stage completely. Gem's smallest employers (1 to 99 staff) pass 25% of applicants to a pre-onsite stage but only 3% of those on to onsite, while companies with 5,000 or more staff pass just 9% to pre-onsite and then 24% to onsite - Gem. Small companies let many applicants into early conversations and then filter hard in the middle. Large companies filter hard up front and then convert their shortlist far more reliably, ending with more than double the end-to-end hire rate (0.7% against 0.3%).
Why this matters: the interview loop is where your most expensive people spend their time, so a low screen-to-onsite rate costs hiring-manager hours rather than recruiter hours. A technical hire consuming 23 to 26 interviewer hours is a real cost line. How to apply this: compare your screen-to-onsite rate with the benchmark for your company size rather than the overall average, track interviewer hours per hire alongside pass rates, and treat a falling onsite passthrough as a calibration problem between recruiter and hiring manager. If recruiters are sending candidates the hiring team rejects three times out of four, a shared scorecard and a sharper intake meeting will do more than extra sourcing. The next gate, from interview to offer, is where that calibration shows up most clearly.
6. Stage 4: Interview to Offer
In Ashby's data, interview-to-offer is the healthiest stage of the 2026 funnel, and the only one that clearly improved since the hiring slowdown of 2023 (Gem's onsite-to-offer rate has instead held flat at 39% for two years). Among candidates who get an interview at Ashby customers, 10.4% in business roles and 7.3% in technical roles reached an offer in Q1 2026, up from lows of 5.0% and 3.9% in early 2023 - Ashby. Ashby says both rates have now surpassed their 2021 levels, and for business roles it is the highest rate in the series. On Ashby's chart the technical rate is still a little below its late-2021 peak of about 9%, so the recovery is strongest outside technical roles.
Those Ashby figures are per interviewed candidate, which explains why they look low next to other benchmarks. Gem measures from the onsite stage onward and finds 39% of onsites turning into offers overall, 37% for inbound and 22% for outbound candidates. Employ reports 31.5% of interviews resulting in an offer in 2025, up from 26.3%, and Appcast's disposition median is 40.45% of interviewed candidates receiving an offer. CareerPlug's small businesses turned 27% of interviews into hires in 2024. Each denominator is a different slice of "interviewed", so compare your own number with the benchmark that starts at the same event.
One benchmark in this group needs a warning label. Employ's interview-to-offer rate runs from 72.2% at enterprises to 16.6% at mid-market companies and just 7.0% at small businesses - Employ. A tenfold gap between company sizes is far more likely to reflect what each group logs as an "interview" in the ATS than genuine differences in interviewing skill. One plausible explanation is that many enterprises log only the final loop as an interview, which would make almost every logged interview a finalist. Treat that split as a likely data-logging artefact rather than a target.
Function drives the rate more reliably than company size. In Gem's data, onsite-to-offer runs from 25% in data science and product management and 28-29% in design and engineering, to 42-43% in customer support and customer success and 38% in sales. Technical hiring teams interview more candidates, ask more of them, and still extend fewer offers per onsite. Regionally the stage has converged: Ashby's EMEA report shows 7.2% of interviewed applications receiving an offer in EMEA against 7.4% in AMER in Q1 2026, after EMEA led at 13.9% against 9.2% in early 2021 - Ashby.
Speed after the interview is where slow teams lose most. Ashby split its customers into the fastest and slowest quartiles by time to hire and measured where the extra days go. The biggest gap was not scheduling or feedback but offer turnaround, the time from a candidate entering the offer stage to the offer being created, which took 3.26 extra days for business roles and 4.71 for technical roles at the slowest companies - Ashby. Decision-to-offer added another 2.2 to 2.7 days. Campus hiring shows the same drag at larger scale: NACE members averaged 27.3 days between a student's first interview and an offer or rejection in 2025 - NACE.
Delay at this stage turns into withdrawals. In Greenhouse's 2025 survey, 50% of US candidates said they had ghosted an employer during a hiring process, up 14 points since October 2023, and 24% said they did so after poor communication or long delays from the employer - Greenhouse. On the employer side, 41% of organizations told SHRM in early 2025 that candidates were ghosting them during the interview process - SHRM. Neither figure is a measured withdrawal rate, but together they explain why the offer-turnaround gap matters so much.
Why this matters: because the top of the funnel got so much tighter, the candidates who reach an interview in 2026 are more pre-qualified than they were in 2021, so a falling interview-to-offer rate is now the clearest warning sign that something is wrong with calibration or the interview process itself. How to apply this: measure interview-to-offer from a clearly defined starting event (first hiring-manager interview or final loop), compare technical and non-technical roles separately, and put a service level on the days between the final interview and a written offer. Ashby's quartile data suggests cutting that gap by three to five days is the cheapest speed gain available to most teams. Once the offer is out, a different set of numbers takes over.
7. Stage 5: Offer to Acceptance
About four out of five offers are accepted in the latest ATS datasets, and this is the stage where the major datasets agree most closely. Gem measures 82% of offers converting to hires in the year to May 2025, the highest level since 2021. Ashby's offer stage passes 81% of candidates through to hired. Employ reports an 83.9% offer acceptance rate for 2025, up from 82.5% in 2024 - Employ. SmartRecruiters' global figure is 87% on its older 2023-2024 data - SmartRecruiters. iCIMS puts the average offer-to-hire conversion across its manufacturing customers at 85% - iCIMS.
The averages hide a consistent pattern by source and function. Ashby's median offer acceptance rates show referrals closing best and sourced technical candidates closing worst, at 76%, while in business roles sourced and inbound candidates tie. Gem's outbound candidates accept at 73% against 81% for inbound, which means an outbound hire needs roughly 1.37 offers against 1.23 for an inbound one. Engineering accepts 73% of offers in Gem's data, while sales, marketing and legal accept 87%.
Offer acceptance by source and function
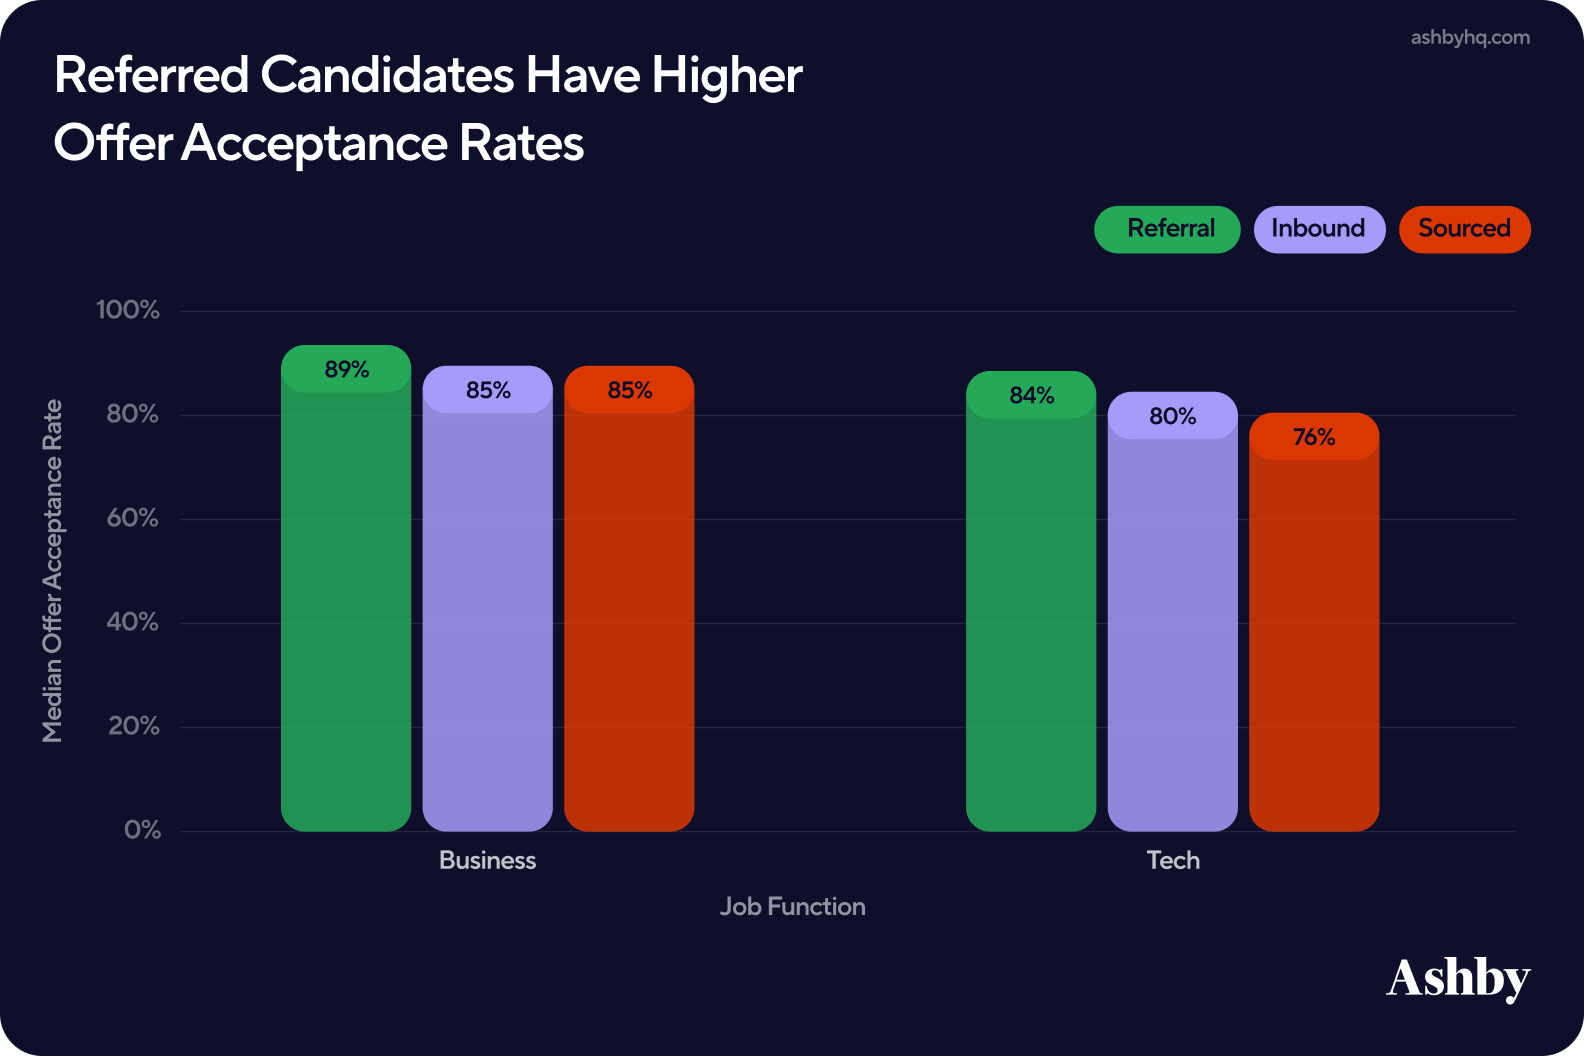
The right-hand group is the one that matters for technical recruiters. A sourced engineer who reaches offer stage was not looking for a job when you found them, often has a current employer ready to counter, and may be weighing several processes at once. The eight-point gap between sourced and referred technical candidates is the price of a cold start, and it is why outbound pipelines for engineering roles need more finalists than inbound ones. Our guide to beating counteroffers for AI talent covers the closing tactics in detail.
Industry and geography move the rate as well. The table below collects the most useful splits from the five datasets that publish them. Note that SmartRecruiters and Gem classify by the employer's industry rather than the role, so a software engineer at a manufacturer counts as manufacturing.
| Segment | Offer acceptance | Dataset and period |
|---|---|---|
| Manufacturing employers | 78-92% | Gem 2025 (78%); iCIMS (85%); Employ 2025 (91%); SmartRecruiters 2023-24 (92%) |
| Hospitality employers | 84-90% | SmartRecruiters 2023-24; Employ 2025 |
| Software and tech employers | 77-82% | SmartRecruiters 2023-24; Employ 2025; Gem 2025 |
| IT services and hardware | 67% | Gem, Jun 2024-May 2025 |
| US-located jobs | 79% | SmartRecruiters 2023-24 (lowest of 5 countries) |
| New college hires (US) | 78.3%, 10.0% renege | NACE 2025 |
The last row adds a stage most employers do not track: acceptance followed by a no-show. NACE's 2025 survey of college recruiters found reneges rose to 10.0% of accepted full-time offers, up from 7.6% in 2023 - NACE. Experienced-hire reneges are harder to measure, but Gartner's candidate survey found 35% of candidates backed out after accepting an offer in the first quarter of 2025, down from 48% a year earlier - Gartner. That is a share of candidates, not of offers, so it cannot be compared directly with an employer's renege rate.
The same distinction explains the most confusing number of 2026. Gartner reported in June 2026 that only 48% of candidates accepted their most recent job offer in the fourth quarter of 2025, down from 85% two years earlier - Gartner. That does not contradict the 81-84% in ATS data. Gartner measures the share of candidates who accepted the last offer they received, and a candidate juggling three offers can only accept one. ATS data measures the share of an employer's offers that were accepted. Never benchmark one against the other.
Why this matters: because acceptance is so stable, a drop of even five points is a meaningful signal, usually about compensation, speed or competition for a specific role family. How to apply this: track acceptance separately for sourced, inbound and referred finalists, and separately for technical and business roles, because the blended rate hides the weakest segment. Plan offer volume with the right multiplier: about 1.2 offers per hire for inbound business roles, closer to 1.4 for sourced engineers. Add a renege check between acceptance and start date for early-career hiring. With the stages covered, the next section follows a different kind of candidate through the funnel: the one you went out and found.
8. The Outbound Funnel: From First Message to Hire
Outbound sourcing converts far better per candidate than inbound, but only after a long, leaky pre-funnel that most benchmarks leave out. Once a sourced candidate is logged in the ATS, Gem measures 86% reaching a pre-onsite stage, 18% of those reaching onsite, 22% of onsites getting an offer and 73% accepting, which works out to 2.5% of sourced candidates hired against 0.3% of inbound applicants, roughly eight times the rate - Gem. Outbound hires take longer, a median of 41 days against 24 for inbound.
The catch is the definition of "logged in the ATS". Gem only counts a sourced person as an application once they have expressed interest, so the 86% first-screen pass rate starts after the hardest part of outbound is already done. Before that point sits the outreach funnel itself, and it is measured separately.
Inbound vs outbound stage conversion (Gem, June 2024 to May 2025)
The chart shows that outbound's entire advantage sits at the first gate. From pre-onsite onward, sourced candidates convert at about the same rate as inbound ones and then worse at the onsite and offer stages, because a passive candidate is harder to close than someone who applied. Sourcing buys you a pre-qualified shortlist, not an easier interview loop, and the offer-stage gap means sourced pipelines need extra finalists to land the same number of hires.
The outreach funnel before the ATS has weakened. Across 6.2 million email sequences sent through Gem in 2025, the reply rate was 16.9% and the interested rate 9.4%, down from 22.6% and 12.1% in 2024, while the open rate barely moved from 76.6% to 75.3% - Gem. Candidates are still reading recruiting email; they are replying to a quarter less of it. hireEZ measured a 15.2% reply rate across 2.7 million recruiting emails in the first half of 2025 - hireEZ. Gem's benchmark report, on its June to May cycle, found 8% of outbound sequences converting to an ATS application within 60 days.
Follow-ups remain the strongest single lever. In Gem's 2025 data, cumulative reply rate climbed from 8.8% after one email to 13.7% after two and 16.3% after three, so a single-touch campaign gives up almost half the replies it could have earned. Switching the sender to a hiring manager or executive after an unanswered step, which Gem calls send-on-behalf-of, lifted reply rates by 23.6% to 61.3% in relative terms. The detailed channel-by-channel picture is in our recruiting outreach benchmarks for 2026.
Chaining Gem's own figures gives a rough end-to-end rate for cold outbound. If about 8% of sequences convert to an ATS application and 2.5% of those are hired, then roughly one hire per 500 sequences sent. That is a derived estimate mixing two Gem populations, not a published benchmark. To test it against your own numbers, use our free candidates-per-hire calculator, which lets you plug in your reply and pass-through rates by role and industry.
HeroHunt.ai
The outbound math in this section is unforgiving: an estimated 500 outreach sequences per sourced hire (derived from two Gem datasets), a reply rate that fell by a quarter in 2025, and follow-ups that nearly double replies, from 8.8% after one email to 16.3% after three in Gem's 2025 data. HeroHunt.ai is built for exactly this top-of-funnel work. Its AI Recruiter searches more than 1 billion profiles, screens them against your brief and runs personalized multi-step outreach on autopilot, so the volume and the follow-up discipline no longer depend on a sourcer's spare hours. The honest caveat: automation improves the top of the outbound funnel, not the bottom. Sourced technical candidates still accept offers less often than referrals (section 7), so keep experienced people on the closing conversations.
Rediscovery is the quiet shift inside outbound. 46.2% of sourced hires at Gem customers in the year to May 2025 were people already in the company's CRM or ATS from an earlier application or campaign, up from 26.3% in 2021, and the share reaches 58.3% at companies with 5,000 or more staff. How much of hiring comes from direct sourcing at all also depends on size: 25.7% of hires at companies under 100 staff against just 7.1% at 5,000 or more. Small companies lean on direct sourcing; large ones increasingly source from their own databases.
Sourcing also matters more for scarce roles. At Ashby customers, technical jobs with "AI" in the title filled 28.0% of hires through sourcing and 9.2% through agencies, against 23.5% and 6.9% for other technical roles, with inbound falling to 37.1% - Ashby. The application flood described in section 4 does not reach the candidates the market is shortest of, so outbound share rises exactly where hiring is hardest.
Gem's own walkthrough of its 2026 outreach benchmarks is worth watching if you run sequences at scale. It walks through the 2025 dataset behind the report, the reasons behind the numbers and real examples of emails that performed, plus a first look at Gem's outreach templates.
Outreach that works: 2026 benchmarks, best practices, and tools in action
One measurement point changes how you should read any outreach benchmark: reply rates are usually quoted per sequence, not per message. A three-email sequence that earns one reply counts as one replied sequence, but only one reply out of three messages. Per-message figures therefore look much lower than per-sequence ones on the same campaign, and comparing a per-message rate with a per-sequence benchmark will always make your outreach look worse than it is.
Why this matters: outbound is the only channel where the recruiter controls the volume at the top, and its conversion inside the ATS is eight times better than inbound, but only if the outreach itself gets enough replies to feed it. How to apply this: measure outbound as two linked funnels (sequences to interested candidates, then ATS application to hire), send at least three touches, reuse your own database before buying new contacts, and budget roughly 1.4 offers per sourced technical hire. The next section compares outbound with every other source on the same scale.
9. Conversion by Source: Referrals, Inbound, Agencies and Internal
Source is one of the strongest predictors of conversion: a referral is about 13 times more likely than an inbound application to reach an interview. Ashby's data on how often an application reaches an interview makes the gap stark: 42% for agency and internal candidates, 40% for referrals, 25% for sourced candidates and just 3% for inbound applicants - Ashby. Inbound accounted for 93.8% of all applications in that January 2021 to December 2024 dataset, referrals for about 1%.
Inbound candidates are least likely to get an interview
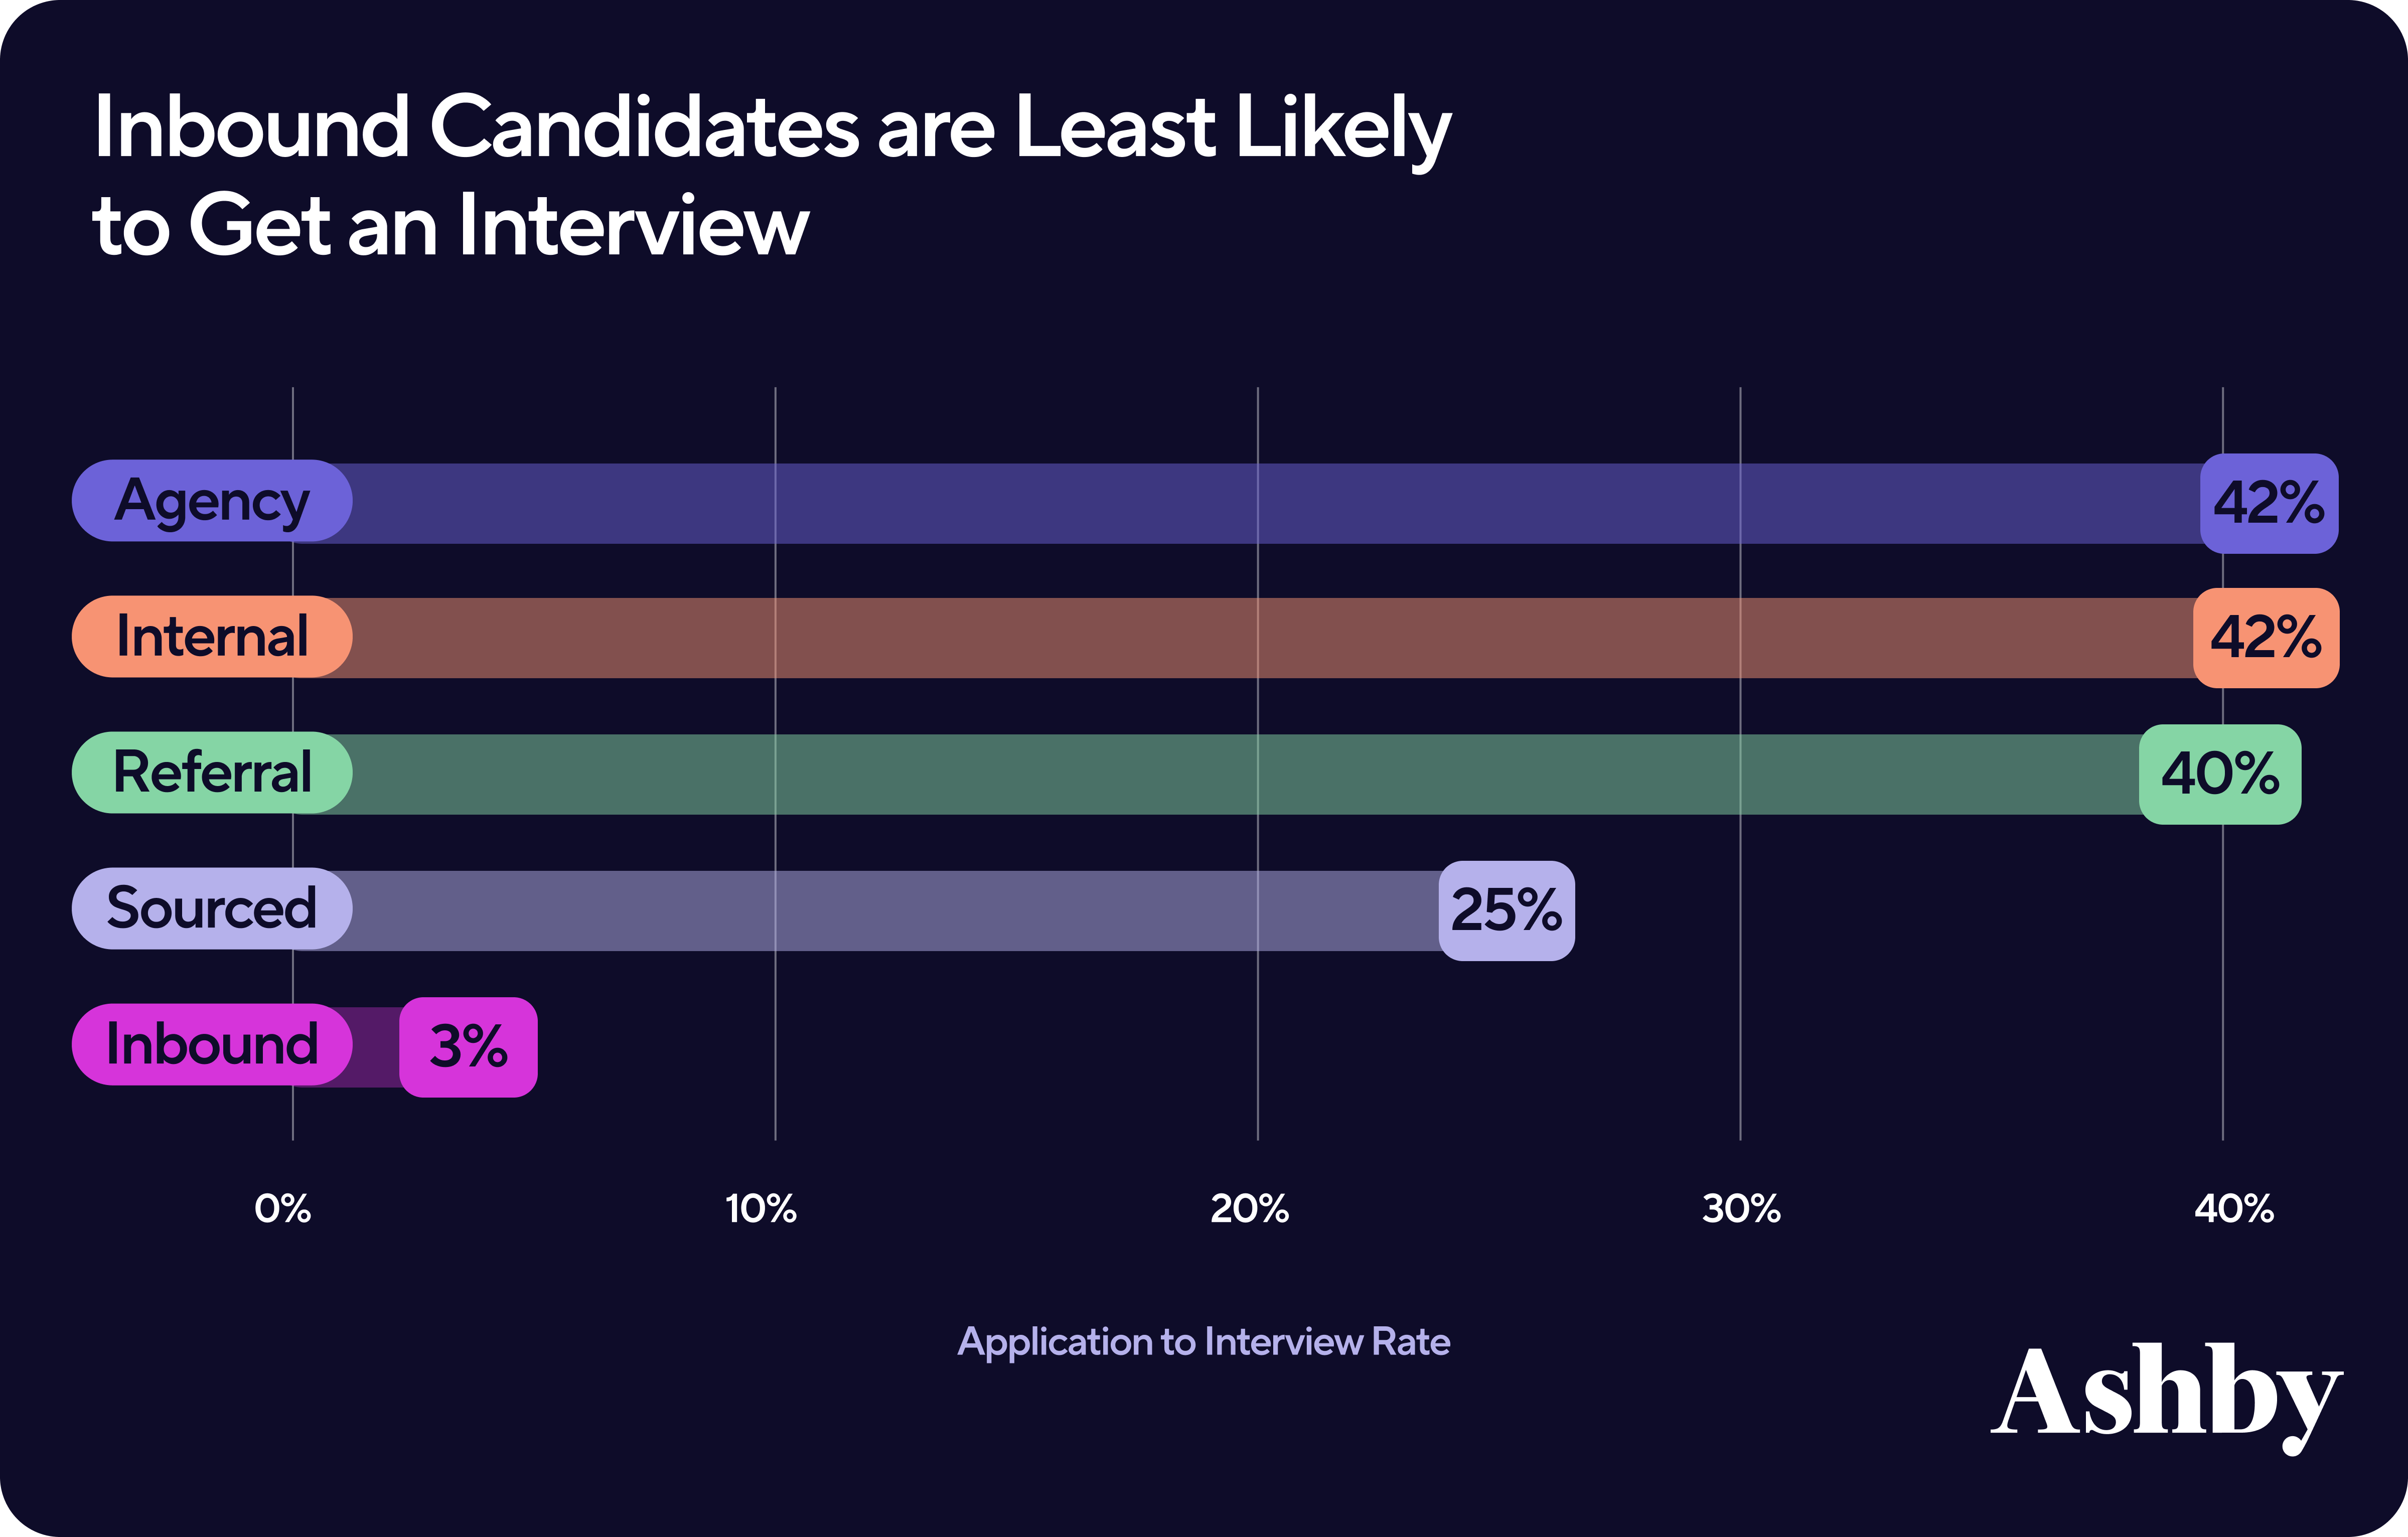
The chart explains why inbound still dominates hiring despite its poor rate. Inbound's 3% interview rate applied to 94% of applications still produces the largest absolute number of interviews, so inbound made up 52% of hires at Ashby customers by Q1 2026, up from 38% in early 2021, with referrals and sourcing at about 17% each - Ashby. Once interviewed, sourced and inbound candidates convert to offers at the same 6%, while referrals convert at 16% and internal candidates at 32% (Ashby customers, January 2021 to December 2024) - Ashby. The sourcing advantage is getting to the interview; the referral advantage persists all the way through.
The effect is visible from the other direction too, as each source's share of applications against its share of hires. The table below combines Gem, Greenhouse and Pinpoint. Pinpoint's column gives median applicants per hire by channel in Q2 2026, which is the most intuitive way to read the gap - Pinpoint.
| Source | Share of applications → share of hires | Median applicants per hire |
|---|---|---|
| Referrals | 1.6% → 16.8% (Gem) | 24 |
| Agencies | 0.2% → 3.4% (Gem) | 27 |
| Sourced / recruiter-sourced | 2.6% → 11.3% (Gem); 2.9% → 9.7% (Greenhouse) | 44 |
| Internal mobility | 0.3% → 9.6% (Gem) | not reported |
| Company career site | 23.8% → 34.4% (Greenhouse) | 161 (direct) |
| Job boards | 50.0% → 27.0% (Gem, incl. sourcing sites); 49.9% → 22.6% (Greenhouse) | 287 |
The job-board row is the key to 2026 budgeting. A job-board hire takes a median of 287 applicants against 24 for a referral, about twelve times the screening work per hire. Greenhouse's North American data shows the employer's own career site outperforming external boards by roughly three times per application - Greenhouse. A plausible reason is that a candidate who found the careers page chose the company deliberately. Referrals from inside the same function perform better still: at Ashby customers (January 2021 to March 2026), same-function referrals in business roles were hired at 5.2% against 3.1% for referrals from other functions - Ashby.
Quality after hire follows the same order, although the gaps are small. Ashby's Quality of Hire scorecards, filled in by hiring managers across nearly 15,000 hires, average 4.0 for referred hires, 3.9 for sourced and 3.8 for inbound on a five-point scale, with 36% of referred hires rated "greatly exceeds expectations" against 28% of inbound hires - Ashby. LinkedIn's network data points the same way: applicants already connected to an employee are 3.6 times more likely to be hired than cold applicants - LinkedIn Economic Graph.
Why this matters: the cheapest way to raise overall funnel conversion is rarely to screen inbound faster; it is to shift a few percentage points of your applicant mix toward sources that convert ten times better. How to apply this: tag every application's source reliably, report conversion by source rather than blended, protect referral and internal candidates from the inbound queue with their own review lane, and spend job-board budget only where volume is genuinely needed. Source is one axis; the next section covers the others that change every benchmark: role, industry, company size and region.
10. Benchmarks by Role, Industry, Company Size and Region
Role family moves the end-to-end conversion rate several-fold, which makes a blended benchmark almost useless for technical hiring. In Gem's June 2024 to May 2025 data, sales roles hired 0.7% of applicants in a median 26 days, while data science hired just 0.1% in 42 days - Gem. Engineering, product management, design, marketing and people roles all sat at about 0.2%. Customer-facing and operational roles convert best because more applicants clear the first screen and more onsites end in an offer.
Application-to-hire rate by department (Gem, June 2024 to May 2025)
The gap comes from both ends of the funnel. Engineering passes 6% of applicants to pre-onsite, 17% of those to onsite, 29% of onsites to offer, and has the lowest offer acceptance of any function at 73%. Sales passes 11%, 20%, 38% and then 87% of offers are accepted. A technical funnel is narrow at the top because inbound volume is enormous and mostly mismatched, and narrow at the bottom because strong technical candidates hold competing offers. Ashby's numbers confirm the workload side: data roles interview 19.5 applicants per hire, product management 18.0 and engineering 17.9, against 9.5 for customer support (Q1 2025 to Q1 2026) - Ashby.
Industry benchmarks are harder, because each vendor classifies by the employer's industry and each has a different customer base. The table below puts the four most useful sources side by side. Read across a row for the range, and notice that technology is the only industry that is high-volume in every dataset.
| Employer industry | Applicants per hire, SmartRecruiters (2023-24) | Median applicants per hire, Pinpoint (Q2 2026) | Application to hire, Gem (2025) | Offer acceptance |
|---|---|---|---|---|
| Technology / software | 110 | 167 | 0.3% | 77% (SmartRecruiters) |
| Financial services | not reported | 115 | 0.4% | 81% (Gem) |
| Healthcare | 40 | 58 | not reported | 77% (SmartRecruiters) |
| Manufacturing | 38 | 59 | 1.4% | 78% (Gem) to 92% (SmartRecruiters) |
| Hospitality | 117 | 50 (incl. transport) | not reported | 84% (SmartRecruiters) to 90% (Employ) |
| Retail | 65 | 79 (consumer goods) | not reported | not reported |
Hospitality shows why you should never quote an industry number without its dataset. It is the highest-volume industry at SmartRecruiters, with 117 applicants per hire and only 1.8% of candidates interviewed (September 2023 to August 2024) - SmartRecruiters. At Pinpoint, by contrast, it is among the lowest-volume industries, with a median of 50. Technology is consistently high: 110 at SmartRecruiters, a median of 167 at Pinpoint and 369.1 applications per job (not per hire) at Employ customers in 2025 - Employ. Inside technology the spread is enormous: Pinpoint's 25th percentile is 59 applicants per hire and its 90th percentile is 710 - Pinpoint.
Company size changes the funnel's shape more than its end rate. Gem's companies with under 100 staff, 100-499 and 500-999 all hire about 0.3% of applicants, companies with 1,000-4,999 hire 0.4% and those with 5,000 or more hire 0.7%, with median time to hire ranging from 20 days at the smallest firms to 29 days in the 500-999 band. Venture-backed startups on Ashby receive 298 to 348 inbound applications per hire depending on size and interview 15 applicants for every hire, and remote startup jobs draw 42% more inbound applications than office-based ones - Ashby.
The clearest seniority effect in the data is on time. Ashby's median time to first fill rises from 52 days for junior roles to 63 for mid-level and 71 for senior roles (January 2021 to March 2026) - Ashby. Executive roles at Ashby customers were also filled through inbound only about 35% of the time, against roughly half of all hires (January 2021 to June 2025) - Ashby. Pinpoint's 2025 median time to fill runs from 37 days for entry-level and support roles to 46 for technical and middle-management roles and 56 for executives - Pinpoint. Senior funnels are slower and lean less on inbound applications.
Region matters most for technical roles. Ashby's September 2026 EMEA report found technical roles in AMER drawing 610 inbound applications per hire against 254 in EMEA, while business roles were much closer at 229 against 170 - Ashby. In the latest quarter of that data, 6.7% of EMEA applications reached an interview against 3.7% in AMER, yet once interviewed the two regions converted to offers at about 7% each. Over the past year of data, median time to hire was 35 days in EMEA against 34 in AMER. Greenhouse's European customers saw 183 applications per job and 136 per hire in 2025, against 244 and 203 in North America - Greenhouse.
Location inside the US matters too. In Gem's data, San Francisco Bay Area employers were the most selective, passing 5% of applicants to pre-onsite and hiring 0.3%, while New York passed 12% and hired 0.4%, other US metros hired 0.7% in a median 18 days and international employers 0.9% in 22 days. Combine location with role family and two perfectly healthy funnels can show end-to-end rates several times apart.
Ashby's own presentation of its EMEA report goes deeper into the regional numbers, with talent leaders from DeepL and Moss discussing the volume paradox, screening load per hire and how they track pass-through rates.
EMEA Talent Trends: Inside the Data Shaping Hiring Today
The regional comparison is a useful reminder that "the market" is really several markets. A European team benchmarking against a US report will conclude it is doing unusually well at the first gate, and a US tech team benchmarking against a global average will conclude it is doing badly, when both are simply facing their own local applicant supply.
Why this matters: benchmarks by role, industry and region can differ by more than your own funnel differs from the average, so the wrong comparison group produces the wrong conclusion. How to apply this: choose the narrowest benchmark that matches your role family and region, prefer a dataset whose customer base resembles yours, and report technical and non-technical funnels separately. If you hire across regions, set separate first-gate targets for each. Time is the other dimension every benchmark should be read against, and it is the subject of the next section.
11. Time in the Funnel: Speed Benchmarks by Stage
Median time to hire sits between about 24 and 40 days in 2026 ATS data, and time to fill runs from about 40 to 76 days, depending on definition and role. Those ranges look inconsistent until you notice that time to hire usually starts when the candidate applies, while time to fill starts when the job opens. Gem's median time to hire is 24 days overall and 41 days for sourced candidates. Ashby's is 30 days for business roles and 40 days for technical roles, with the fastest quarter of hires closing in 18 and 26 days respectively.
Time to fill is longer, and its direction depends on the dataset. Greenhouse's North American customers took about 60 days to fill a job in 2025, up 37% since 2022 (59.67 days on its benchmarks page), while Employ customers took an average 63.5 days from posting to accepted offer, down from 67.7 days in 2024. iCIMS reported 40 days in August 2026 - iCIMS. SHRM's 2025 benchmarking survey gives a median of 44 days for non-executive and 45 days for executive roles, measured from requisition to accepted offer - SHRM.
| Metric | 2026 benchmark | Start and end events | Source and period |
|---|---|---|---|
| Time to hire (median) | 24 days; 41 for sourced | Application in ATS → hire | Gem, Jun 2024-May 2025 |
| Time to hire (median) | 30 days business, 40 technical | Application → hire | Ashby, Q2-Q3 2025 |
| Time to hire (average) | 46.2 days | First candidate interaction → accepted offer | Employ, 2025 |
| Time to fill (average) | ~60 days | Job opened → filled | Greenhouse NA, 2025 |
| Time to fill (median) | 44 days non-exec, 45 exec | Requisition → offer accepted | SHRM survey, early 2025 |
| Time to first fill (median) | 56 days business, 76 technical | Job opened → first hire | Ashby Recruiter Productivity report, to Mar 2026 |
| Time to first screen (average) | 7.2 days | Application → first screen | Employ, 2025 |
The definitions column is the whole point of the table. A 24-day time to hire and a 63.5-day time to fill can describe the same process: the job opens, sits unfilled while candidates arrive, and the eventual hire moves from application to offer in three to four weeks. Much of the difference between the two numbers is the wait before the right applicant shows up, which is exactly the part of the timeline that outbound sourcing compresses.
Inside the funnel, time accumulates in a few specific places. SHRM finds screening and interviewing each take roughly 8 to 9 days on average within the posting-to-acceptance process. Employ measures 7.2 days from application to first screen and 3.6 days to schedule an interview once a candidate advances. Ashby's hired technical candidates spend a median 17.9 days between first and last interview, and the slowest companies lose 3 to 5 extra days purely on offer turnaround. On campus, NACE finds students take 9.0 days on average to respond to an offer, down from 15.7 days in 2021.
Speed changes conversion, not just duration. In the 2025 Candidate Experience benchmark, covering more than 66,000 candidates at over 110 employers, 60% of candidate respondents said their offer letter arrived less than a week after their last interview, and offers made within a week more than doubled candidates' willingness to refer others (a 108% increase) - Survale / CandE. On the staffing side, 40% of candidates who gave up on a recruiter said the process did not move quickly enough - Bullhorn. Every extra week in the middle of the funnel is a week in which a strong candidate can accept somewhere else.
Cost follows time, and it has the same mean-versus-median trap. SHRM's widely quoted $5,475 average cost per hire for non-executive roles is the mean, and the executive mean is $35,879 - SHRM. The medians in the same 2025 dataset are just $1,200 for non-executive and $10,625 for executive roles - SHRM. Appcast's median advertising cost per hire, which excludes recruiter time, was $1,053 in its 2025 candidate-disposition data, while its monthly series for jobs using full ATS applications stood at $1,340 in October 2025, the latest month it reports - Appcast. If you benchmark cost per hire, say which statistic you use, or you will be comparing a typical company with an average distorted by a few very expensive hires.
Why this matters: time is where candidates are lost silently, through withdrawals and competing offers that never show up as a rejection in the ATS. How to apply this: define every time metric by its start and end event, track the median and the 75th percentile rather than the mean, and set service levels on the three delays you control: time to first review, time from interview to decision, and time from decision to written offer. Agencies live and die by the same clock, which makes their funnel a useful comparison.
12. The Agency Funnel: Submittals, Interviews and Placements
Agency funnels leak before the client ever sees a candidate: about 11% of screened candidates are submitted, but nearly half of submittals get an interview. Recruiterflow's analysis of a full year of operational data from more than 2,100 recruitment and executive search firms found that one placement takes about 213 sourced candidates, only about 3% of sourced candidates ever reach client submission, and the average firm needs 7 submissions to close one hire - Recruiterflow. Downstream, about 46% of submittals reach an interview and about 33% of interviews end in a hire.
Those numbers overturn the most repeated rule of thumb in agency recruiting, that three to five submittals produce one interview. A 46% submit-to-interview rate is closer to two submittals per interview. The folklore appears to have no measured source; its oldest traceable ancestor is a 2014 Bullhorn survey of 1,337 staffing firms that reported four submissions per hire for contingent search and temp work, based on 2013 performance - ERE. Twelve years later, measured platform data points to about seven submissions per hire across a broader set of firms.
| Agency funnel stage | Benchmark | Notes |
|---|---|---|
| Sourced candidates per placement | 213 | All sources blended |
| Screened → submitted to client | 11.3% | ~16.5% retained, ~11.6% contingent |
| Submitted → client interview | ~46% | About 2 submittals per interview |
| Client interview → hire | ~33% | About 3 interviews per placement |
| Submissions per placement | 7 | Top firms convert screens at 16-19% |
Source matters as much for agencies as for employers. In the same dataset, LinkedIn-sourced candidates needed 283 candidates per hire with a 17% interview-to-hire rate, job boards 81, the agency's own website 33, and referrals just 20, converting from interview to hire at nearly 79%. Seventy-one percent of placements came from candidates already in the firm's CRM before the job opened. The top quarter of firms by revenue per recruiter made 5.21 placements per recruiter per year against 1.38 for the rest, while adding fewer new candidates (800 against 930) and taking slightly longer to first submission (a median 19.7 days against 15.3).
Fill rates show how much work never pays. UK agencies using Firefish placed only 24% of the permanent jobs they took on in 2025, while temp and contract work dominated placements - Firefish. Bullhorn's opted-in ATS data shows fill rates improving: its fill-rate index stood at 123 for permanent and 132 for temporary roles in August 2026 against a January 2019 baseline of 100, while submissions per job order stayed roughly flat - Bullhorn. Agencies are converting more job orders without submitting more candidates per order.
Speed and closing are where agency surveys point. In Bullhorn's GRID 2026 survey of about 2,300 staffing professionals, 56% of the fastest-growing firms reported an average time to place under ten days, and firms reported that two to three out of five candidates who receive offers still turn them down, most often for a better offer elsewhere - Bullhorn GRID. Those are self-reported figures rather than measured funnel data, and a turn-down rate of two to three in five is far worse than the roughly one in five offers declined in employer ATS data, so the agency offer stage is where in-demand candidates are most fragile.
Why this matters: agency economics depend on the screen-to-submission gate, because every screened candidate who is not submitted is recruiter time with no revenue. Recruiterflow's own model estimates that a 10% improvement in submit-to-interview conversion lifts revenue per recruiter by about 3.3% - Recruiterflow. How to apply this: measure submittals per placement rather than submittals per interview, invest in rediscovering candidates already in your CRM before sourcing new ones, and treat LinkedIn-sourced pipelines as a volume channel that needs far more candidates per placement than referrals or your own website. The biggest force acting on all of these funnels in 2026, agency and in-house alike, is AI.
13. How AI Is Changing Funnel Conversion in 2026
AI is widening the funnel at the top and narrowing the human effort in the middle, and the net effect on conversion depends on which side of the table uses it better. Candidates use AI to apply to more jobs with better-looking applications, which floods the first gate and erodes its signals. Employers use AI to screen, schedule, interview and source, which recovers capacity but introduces new drop-off points and new failure modes. The measured evidence on both sides is now strong enough to plan with.
The application flood and the lost signal
Application volume has roughly doubled per job since 2022 and tripled per hire since 2021, and the growth is finally moderating. Ashby's applications per hire eased from above 300 through 2025 to 291 in Q1 2026, Pinpoint's global median fell from 96 in Q3 2025 to 76 in Q2 2026, and LinkedIn's own pressroom now cites about 8,200 applications per minute on the platform - LinkedIn, below the 11,000 widely reported in mid-2025. The flood has plateaued at a high level rather than receded.
The bigger cost is lost signal. Beyond the cover-letter evidence in section 4, a structural model built on Freelancer.com data found that once written applications stop carrying signal, the strongest fifth of workers are hired 19% less often and the weakest fifth 14% more often - Galdin and Silbert. Those are simulated counterfactuals rather than observed outcomes, but they point to a real risk: a screen that relies on how polished an application reads now rewards the tool, not the candidate. Fraud compounds the problem for remote technical roles, where identity-verification startup Endorsed says applications carrying North Korean IT-worker fraud patterns rose from 11% of the US remote IT applications in its data in the third quarter of 2024 to 44% a year later, and 47% in its latest quarter - Fortune. Those are flagged patterns, not confirmed fraud.
AI screening and AI interviews
The strongest causal evidence on AI in the funnel comes from a randomized field experiment on 70,884 applications for entry-level customer service jobs at an outsourcing firm in the Philippines, in which some applicants were interviewed by an AI voice agent while human recruiters still made the decisions. Applicants interviewed by the AI received offers 12% more often (9.73% against 8.70%), started jobs 18% more often and were 18% more likely to still be employed a month later, and 78% chose the AI interviewer when given the choice - Jabarian and Henkel. One co-author later took an unpaid role at the firm, which the paper discloses.
A second randomized study on engineering roles found recruiters who saw an AI interview report shortlisted finalists who passed a blind final human interview 46% of the time against 29% for recruiters who saw resumes only. But only 25% of invited applicants completed the 30-to-40-minute AI interview - Aka, Palikot, Ansari and Yazdani. Two authors are affiliated with micro1, whose platform ran the experiment. The lesson is that AI interviews can raise quality at the next stage while removing a large share of applicants at the step itself.
Candidates are split on the experience. In Greenhouse's 2026 survey of 1,200 US job seekers, 63% had been interviewed by an AI, 38% said they had walked away from a hiring process because it included an AI interview, and among those who completed one, 28% moved forward, 13% were rejected and 51% never heard back - Greenhouse. Transparency is part of the problem: in a Gartner survey of 254 candidates who had an AI interview, only 31% had been told in advance - Gartner. Staffing candidates are more positive: 57% of respondents in Bullhorn's 2026 candidate survey had been interviewed by an AI voice agent, and 92% of them rated it as good as or better than a live recruiter - Bullhorn.
AI sourcing and outreach
On the outbound side, the published lifts are relative and they move over time. LinkedIn's Hiring Assistant charter customers reported saving more than four hours per role, reviewing 62% fewer profiles and a 69% improvement in InMail acceptance when LinkedIn announced global availability in September 2025 - LinkedIn. Its product page now cites January 2026 data showing 81% fewer profiles reviewed and 66% higher InMail acceptance. The only absolute rate LinkedIn publishes is a single customer, staffing firm NES Fircroft, at 65% InMail acceptance for Hiring Assistant-sourced candidates against 39% for manually sourced ones. Our LinkedIn Hiring Assistant cost guide covers pricing and alternatives.
Independent outreach data shows smaller, observational gains. hireEZ found AI-supported recruiting emails reached a 17.6% reply rate against 13% without AI in the first half of 2025, and noted the best results came from AI drafts edited by recruiters - hireEZ. This comparison was not randomized, so recruiters who adopt AI early may simply be better at outreach already. The defensible conclusion is that AI assistance correlates with modestly higher reply rates, not that it guarantees them.
Who is building what
The market has consolidated at the top and fragmented underneath. Workday completed its acquisition of conversational-AI hiring company Paradox in September 2025 for a purchase consideration of $1.1 billion - Workday 10-Q. A new generation of AI-native players raised large rounds on the promise of automating whole stages of the funnel, and the table below maps the notable ones to the stage they target. For list prices across these categories, see our recruiting software pricing guide.
| Funnel stage | Player | What it changes | Verified figure |
|---|---|---|---|
| Apply and early screen | Paradox (Workday) | Conversational apply and scheduling for frontline roles | Chipotle cut time to hire from 12 to 4 days |
| Sourcing and outreach | LinkedIn Hiring Assistant | Agentic sourcing inside LinkedIn Recruiter | +66-69% InMail acceptance (relative) |
| Sourcing and outreach | Juicebox | Natural-language search and outreach over 800M+ profiles | $80M Series B at $850M valuation (Mar 2026) |
| Sourcing and outreach | HeroHunt.ai | Autonomous AI Recruiter: search, screening and outreach across 1B+ profiles | Free to start |
| AI interviewing | Alex | Live AI video and phone interviews with fraud detection | $17M Series A led by Peak XV (Sep 2025) |
| AI interviewing | micro1 | AI interviewer (Zara) vetting experts for AI-lab work | $35M Series A at $500M valuation (Sep 2025) |
| Interview intelligence | Metaview | AI notes and hiring agents across the loop | $35M Series B led by GV (Jun 2025) |
The table is a map, not a ranking, and every row carries a different kind of evidence. Paradox's figure is a single customer's result, LinkedIn's is a relative lift on an undisclosed base, and the funding rounds say more about investor conviction than about conversion. The consistent thread is that each product attacks a stage where the 2026 funnel is weakest: the first screen, the cold outreach, or the scheduling and interview time in the middle. Juicebox's Series B shows how quickly capital is flowing into AI sourcing - Juicebox. The micro1 round shows the same for AI interviewing - TechCrunch.
Why this matters: AI now sits on both sides of every stage, so the benchmark you inherited from 2023 describes a funnel that no longer exists. How to apply this: measure AI steps as explicit funnel stages with their own completion and pass rates, offer candidates a choice where you use AI interviews, verify identity before investing interview hours in remote technical candidates, and judge any AI tool by the conversion of the stage it touches rather than by the relative lift in its marketing. Our ranking of autonomous AI recruiters for 2026 compares the sourcing agents in more depth. Even with good data and good tools, funnel optimization has clear failure modes, and they are the subject of the next section.
14. Where Funnel Optimization Fails
Most funnel optimization fails not because teams lack data, but because they optimize a ratio instead of an outcome. A conversion rate is a fraction, and a fraction can be improved by shrinking the denominator as easily as by growing the numerator. Raise your screen pass rate by lowering the bar and you will hit the benchmark while flooding the interview loop, where Ashby measured technical hires already costing 23.3 interview hours each in Q1 2026 - Ashby. Cut applications with a longer form and your apply-to-screen rate will look better while total hires fall. Every stage metric needs a volume metric beside it.
The second failure is comparing against the wrong era. Benchmarks written in 2022 describe a market with 0.54 unemployed people per job opening in the US (the 2022 average, against about 0.87 in 2021); by July 2026 there were about 0.95 (ratios derived from Bureau of Labor Statistics series) - BLS. Since early 2021, applications per hire at Ashby customers have roughly tripled, from about 100 to 291. A 2021 screen-pass benchmark of 7-8% applied to a 2026 funnel makes every team look broken. The reverse also holds: if hiring demand recovers in 2027 while the labor force keeps shrinking, 2026 benchmarks will start to understate what a healthy first gate looks like.
The third failure is trusting the arithmetic of other people's numbers. Stage medians from different candidates do not chain into a funnel, relative lifts without a base rate cannot be converted into expected results, and vendor claims shift between editions. LinkedIn's Hiring Assistant went from 62% fewer profiles reviewed in September 2025 to 81% in its January 2026 data, and its "hours saved" figure changed from over four hours per role to 1.5 hours per role spent identifying top applicants. None of that is dishonest, but none of it is a benchmark you can plan hires with.
The fourth failure is statistical noise. A requisition with three hires cannot produce a meaningful stage conversion rate, because one candidate moving between stages changes the rate by double digits. Distributions are also wide even in large datasets: technology employers' applicants per hire run from 59 at the 25th percentile to 710 at the 90th in Pinpoint's Q2 2026 data. Averages across a small team's jobs will swing from quarter to quarter for reasons that have nothing to do with process quality.
Three measurement traps catch teams most often, and each one looks like a performance problem when it is really a measurement problem:
- Comparing means with medians, as with SHRM's 2025 nonexecutive cost per hire, a $5,475 mean against a $1,200 median - SHRM
- Counting fraudulent applicants in the denominator and blaming the screen for rejecting them
- Unmeasured AI steps, such as an AI interview that only 25% of invited engineers completed
The fraud trap is growing fastest: in Greenhouse's own pilot on a machine learning role, more than 35% of applicants carried high-risk fraud signals and 91% of the high-risk candidates its security team reviewed were confirmed fraudulent - Greenhouse. That was a single role, not a benchmark, but on remote technical requisitions a low application-to-screen rate may partly reflect applicants who were never real. The fix is to measure the problem as its own stage, verification, and report screen conversion on verified applicants only.
Survivorship bias is the last and subtlest trap. Quality-of-hire comparisons by source, like Ashby's referral score of 4.0 against 3.8 for inbound, are measured only on people who stayed long enough to be scored, and Ashby itself warns that early leavers may never be rated. Offer acceptance hides reneges and early quits that happen after the ATS records a hire. A funnel that looks efficient on paper can still be producing hires who leave in the first three months.
Why this matters: a funnel metric that can be gamed or misread will be, especially once it is on a dashboard reviewed by leadership. How to apply this: pair every conversion rate with the volume behind it, use medians and percentiles, report fraud and AI steps as explicit stages, and check new-hire retention before you celebrate a conversion gain. With those guardrails, benchmarking your own funnel becomes straightforward, and the next section shows how.
15. How to Benchmark and Plan Your Own Funnel
The most useful thing you can do with 2026 benchmarks is run your hiring plan backwards through them. Start from the number of hires you need, divide by each stage's conversion rate in reverse, and you get the number of applications, sourced candidates, screens and interviews the plan actually requires. That turns "we need more candidates" into a specific capacity number for recruiters, hiring managers and the sourcing budget, and it exposes an unrealistic plan before the quarter starts rather than after it ends.
The method has five steps, and none of them requires special software. Most ATS platforms already export the stage data, and a spreadsheet handles the arithmetic. What matters is doing the steps in order, because a benchmark comparison is meaningless until your own stage definitions are fixed. If you have never mapped your stages formally, our recruitment funnel guide explains what each stage from prospect to hire is for.
| Step | What to do | What you get |
|---|---|---|
| 1. Fix stage definitions | Name the start and end event of every stage and map your ATS stages to them | Rates you can compare |
| 2. Measure your own rates | Compute stage-to-stage conversion for the last two quarters, by source and by technical versus non-technical roles | Your baseline |
| 3. Choose the matching benchmark | Pick the dataset closest to your customer base, region and role mix (sections 2 and 10) | A fair comparison |
| 4. Run the plan backwards | Divide target hires by each stage rate, from the offer back to the application | Volume and capacity per stage |
| 5. Diagnose the biggest gap | Find the stage furthest below benchmark that also carries the most volume | Your first fix |
Step four is where the benchmarks become a plan. The short script below does the reverse-funnel math for a team that needs four engineering hires next quarter, two expected from inbound and two from outbound sourcing, using Gem's 2026 stage rates for all engineering applicants (a blend of sources, so an inbound-only funnel will need somewhat more volume) and for sourced candidates. The same calculation works in any spreadsheet: multiply the stage rates together and divide the number of hires by the result.
# Reverse-funnel planner: how much top-of-funnel volume a hiring plan needs.
# Stage rates are Gem's 2026 benchmarks (June 2024 to May 2025). Replace them with your own.
inbound_engineering = [0.06, 0.17, 0.29, 0.73]  # application > pre-onsite > onsite > offer > hire
outbound_in_ats = [0.86, 0.18, 0.22, 0.73]      # sourced candidate in ATS > ... > hire
sequence_to_ats = 0.08                          # outreach sequences that become an ATS application

def volume_per_hire(rates):
    product = 1.0
    for rate in rates:
        product *= rate
    return 1 / product

hires_inbound, hires_outbound = 2, 2
applications = hires_inbound * volume_per_hire(inbound_engineering)
sequences = hires_outbound * volume_per_hire(outbound_in_ats) / sequence_to_ats
print(round(applications), "applications and", round(sequences), "outreach sequences")
# Output: 926 applications and 1006 outreach sequences
The output is sobering and useful. Two inbound engineering hires need about 926 applications, which at Gem's rates means roughly 56 first screens, 9 or 10 onsites and 3 offers. Two sourced hires need about 1,000 outreach sequences, because only 8% of sequences turn into an interested candidate in the ATS. Those 80 or so sourced candidates in the ATS then need about 69 screens, 12 or 13 onsites and 3 more offers, so the full four-hire plan needs roughly 125 screens, 22 onsite loops and 5 to 6 offers. If your team can realistically run that many in a quarter, the plan fits; if it cannot, you now know exactly which capacity is missing. Our free candidates-per-hire calculator runs the same math with role, industry and outreach adjustments built in.
Step five is diagnosis. Once your rates are next to the right benchmark, the decision tree below points to the most likely cause of a shortfall. It deliberately starts at the top of the funnel, because a problem there distorts every rate below it.
The final branch is the one teams most often reach by elimination: every stage converts at a healthy rate, and there are simply not enough candidates entering the funnel. That is the situation where outbound sourcing and referrals pay off most, because they add candidates at the stage where conversion is highest. If an earlier branch fires instead, fixing it will usually yield more hires than any amount of extra sourcing.
Why this matters: a funnel plan built from explicit stage rates survives contact with the quarter far better than a headcount target with no capacity math behind it. How to apply this: rerun the reverse funnel at the start of every quarter with your own trailing rates, compare each stage with the matching benchmark, fix the highest-volume gap first, and re-baseline benchmarks at least twice a year, because the market underneath them is moving. Where it is moving is the subject of the next section.
16. Future Outlook: The Funnel in 2027
The next shift in funnel benchmarks will come from the labor market turning, not from recruiting technology alone. US job openings in July 2026 were 7.3 million, back at their 2019 average, but hires were 5.1 million, about 13% below 2019, so each opening is producing fewer hires than before the pandemic, and the hires rate averaged 3.3% in the first seven months of 2026, the same pace as 2012 (both comparisons derived from BLS series) - BLS. iCIMS sees the same gap on its platform: in August 2026, openings were up 13% year over year while hires were up only 2%, which iCIMS says "points away from a sourcing problem and toward a conversion one" - iCIMS.
Demand is showing the first signs of turning. Indeed's Job Postings Index reached 103.5 in September 2026, about 3% above its pre-pandemic baseline, and rose 0.7% year over year, the first positive annual reading in almost four years - Indeed Hiring Lab. Software development postings, still 23% below pre-pandemic, were up 19% on a year earlier. Actual hiring has not followed yet: LinkedIn's US hiring rate was 6.5% lower in August 2026 than a year before and 25% below its February 2020 pace - LinkedIn Economic Graph.
Supply is moving the other way. Indeed estimates the US civilian labor force has shrunk by around 700,000 workers so far in 2026, which, if it holds through year-end, would make 2026 only the fifth calendar year since 1948 with a shrinking labor force - Indeed Hiring Lab. More openings chasing fewer workers is the classic recipe for rising screen pass rates and falling offer acceptance. Application volume per hire has already stopped growing, as Ashby's 291 and Pinpoint's falling median show, so the first gate is likely to loosen in 2027 if demand keeps recovering.
AI will keep reshaping the funnel from both sides. On the candidate side, 22% of US job seekers told Greenhouse in mid-2025 that they use AI agents to submit applications on their behalf - Greenhouse. Indeed says its Career Scout agent lets job seekers find and apply to relevant jobs seven times faster, with 38% higher hires per application in its own May 2025 test data - Indeed. On the employer side, AI interviews, AI sourcing agents and identity verification are becoming standard stages. The share of US job postings mentioning AI rose to about 6.7% by the end of August 2026, according to Indeed's open AI tracker - Indeed Hiring Lab AI tracker.
Based on the data above, several changes look likely over the next twelve to eighteen months. These are projections from the trends in this guide, not published forecasts:
- Screen pass rates rise modestly if openings keep growing faster than applications
- Verification becomes a formal stage, reported separately from screening in ATS benchmarks
- Offer acceptance softens for technical and AI roles as competition for them returns
A fourth shift is already visible in the data: outbound sourcing takes a larger share of hires for scarce roles, as it already does for AI-titled jobs, and that share should grow as competition for technical talent returns. Each of these would change which benchmark matters most. If screen pass rates recover while offer acceptance softens, the bottleneck moves from recruiter capacity at the top to closing power at the bottom, and teams that spent 2024-2026 building screening automation will need to rebuild their offer and candidate-experience muscle. Ashby's move to publish Quality of Hire alongside conversion is a hint of the next phase too: once volume stops being the problem, the benchmark that matters is whether the hires the funnel produces actually work out.
Why this matters: benchmarks are snapshots of a moving market, and the 2026 snapshot captures a peak in applicant volume that is starting to ease and a trough in hiring that has not yet turned. How to apply this: re-baseline your funnel every quarter against the freshest measured sources (Pinpoint quarterly, iCIMS monthly, Ashby and Gem annually), watch offer acceptance for early signs of a tightening market, and build closing capacity before you need it. The final section turns all of this into a simple decision framework.
17. Conclusion: Which Benchmark to Use, and When
The right recruiting funnel benchmark is the one measured on candidates like yours, over the same stage boundaries, in the last twelve months. The 2026 data tells a consistent story once denominators are aligned: about 5% of job-ad clicks become applications, only about 4-8% of applications reach a first screen, a fifth to a third of screened candidates reach the interview loop, 25-43% of onsites end in an offer depending on function, and 81-84% of offers are accepted. End to end, that is one hire per 200 to 300 applications, or roughly one per 500 cold outreach sequences.
The table below maps common situations to the benchmark that fits best. Use it as the starting point for your own comparison, then narrow further by source, role and region using sections 9 and 10.
| Your situation | Best benchmark | Key numbers |
|---|---|---|
| Tech company, mostly inbound | Ashby Talent Trends 2026 | 291 applications per hire; 3.6-4.7% reach interview |
| Mixed roles, mid-market or enterprise | Gem 2026 or Greenhouse Hire Standard | 8% / 19% / 39% / 82% stage chain; 203 per hire |
| Small business, hourly roles | CareerPlug 2025 report (2024 data) | 180 applicants per hire; 3% interviewed; 27% of interviews hired |
| Paid job advertising | Appcast 2026 | 5.19% apply rate; $19.32 per application |
| Outbound sourcing | Gem outreach and benchmarks | 16.9% reply; 8% to ATS; 2.5% of sourced hired |
| Agency or search firm | Recruiterflow 2026 | 7 submissions per hire; 46% submit to interview |
| Offer planning | Gem, Ashby, Employ | 1.2 offers per hire inbound; about 1.4 for sourced engineers |
Five rules summarize everything above. Benchmark each stage against its own start and end event. Prefer medians and percentiles to means. Compare with 2025-2026 data only, because the market of 2021 no longer exists. Report funnels by source and by technical versus non-technical roles, because the blended rate hides the weakest segment. And fix the highest-volume gap first, which in most 2026 funnels is the first screen, not the offer.
For teams whose diagnosis lands on the final branch of section 15, where every stage converts well but too few candidates enter, the answer is more of the right candidates at the top. That can mean referral programs, rediscovery of candidates already in your ATS, or AI sourcing tools that search and contact candidates at scale; HeroHunt.ai is one such option, alongside the others compared in section 13.
Know your stage rates, run the reverse funnel, then fill the top of it: HeroHunt.ai's AI Recruiter searches 1B+ profiles, screens candidates against your brief and runs personalized outreach on autopilot.
This guide reflects recruiting funnel data available as of September 2026. Benchmark datasets are revised between editions, vendors define stages differently, and labor-market conditions are shifting quickly, so verify the methodology and period behind any number (including these) before holding your team to it.