


The 2026 benchmarks for how long hiring really takes, by role, seniority, industry, company size and region, plus the fixes that measurably shorten it.
In 2026 the typical hire takes 24 to 46 days from application to accepted offer, and the typical job stays open for 39 to 64 days before someone says yes. Gem's dataset of 1.2 million hires puts the median time to hire at 24 days - Gem. Ashby's customers take a median of 30 days for business roles and 40 days for technical roles - Ashby. SHRM's 2026 benchmarking survey puts the median time to fill a non-executive job at 39 calendar days - SHRM. Employ's 6,640 customers averaged 63.5 days from job posting to accepted offer in 2025 - Employ.
But here is the problem: "average time to hire" is three different numbers wearing one label. Some vendors start the clock when the candidate applies, others when the job opens, and a few when the requisition is approved. Some report a median, some an average, and many never say which. The gap is not academic. Gem's 2025 report put the average time to hire at 41 days for 2024, while its 2026 report, covering an overlapping period, put the median at 24 days. Same vendor, similar customers, a 17-day difference, because a minority of very slow hires drags the average up. Worse, most of the time a role stays open is not spent assessing anyone. It is spent waiting: for the right person to apply, for interviewers to free up their calendars, and for a decision after the last interview.
This guide gives you the real 2026 benchmarks for time to hire and time to fill, broken down by job function, seniority, industry, company size and region. It covers the roles where the clock runs very differently (nurses, physicians, hourly workers, federal jobs and executives), shows where the days actually go stage by stage, and explains whether hiring is getting faster or slower. It then ranks the fixes by evidence strength, separates vendor claims from measured results on AI tools, and closes with a 30-day plan to benchmark and cut your own number. Every figure names its dataset, its definition and its period, because a time-to-hire number without its start and end events is not a benchmark.
Written by Yuma Heymans (@yumahey), founder of HeroHunt.ai, whose AI Recruiter finds and contacts candidates across more than a billion profiles for 15,000+ recruiters. Building a product whose whole job is shortening the wait for the right candidate means watching this clock every day, including the days nobody reports.
Contents
- The Short Answer: Average Time to Hire in 2026
- Time to Hire vs Time to Fill: Definitions That Change the Number
- Time to Hire by Job Function
- Time to Hire by Seniority: Entry Level to Executive
- Time to Hire by Industry
- Specialist and High-Volume Roles: Nurses, Physicians, Hourly, Public Sector
- Time to Hire by Company Size and Region
- Is Hiring Getting Faster or Slower? The 2021-2026 Trend
- Where the Days Actually Go: A Stage-by-Stage Time Budget
- What Slow Hiring Really Costs
- Fixes That Measurably Cut Time to Hire
- How AI and AI Agents Are Changing Time to Hire
- When Faster Hiring Backfires: Limits and Failure Modes
- How to Benchmark and Cut Your Own Time to Hire in 30 Days
- Future Outlook: Time to Hire in 2027 and Beyond
1. The Short Answer: Average Time to Hire in 2026
The typical 2026 hire takes about a month from application to accepted offer, and the typical job takes six to nine weeks to fill from the day it opens. Those two ranges cover almost every credible dataset published in the past year, once you sort the figures by what they actually measure. The application-to-offer clock, which most vendors call time to hire, runs from a median of 24 days in Gem's data to an average of 46.2 days in Employ's. The job-open-to-acceptance clock, usually called time to fill, runs from a median of 39 days in SHRM's 2026 survey to an average of 63.5 days at Employ customers.
The spread inside each range comes mostly from three things: whether the figure is a median or an average, which customer base the vendor serves, and how many technical roles sit in the mix. Venture-backed technology companies dominate Ashby's and Gem's data, small businesses carry more weight in Employ's (its JazzHR customers are mostly small employers), and SHRM's numbers come from a survey of HR professionals rather than from software logs. The table below sorts the most useful 2026 figures by the event that starts and stops the clock, so that you compare like with like.
| Metric | 2026 benchmark | Clock starts and stops | Source and period |
|---|---|---|---|
| Time to hire (median) | 24 days; 41 for sourced candidates | Candidate enters the ATS → hire | Gem, Jun 2024 to May 2025 |
| Time to hire (median) | 30 days business, 40 days technical | Application → accepted offer | Ashby, Q2 to Q3 2025 |
| Time to hire (median) | 34 days Americas, 35 days EMEA | Application → hire | Ashby, year to June 2026 |
| Time to hire (average) | 46.2 days | First candidate interaction → accepted offer | Employ, 2025 |
| Time to fill (median) | 39 days non-executive, 45 days executive | Requisition opened → offer accepted | SHRM survey, 2026 |
| Time to fill | 40 days | Not defined in the release | iCIMS, August 2026 |
| Time to fill (median) | 41 to 55 days by seniority | Job goes live → candidate accepts | Pinpoint, 2026 to date |
| Time to fill | 56.7 days North America, 62.2 days Europe | "Days to fill a job" (not further defined) | Greenhouse, 2025 |
| Time to fill (average) | 63.5 days | Job posting → accepted offer | Employ, 2025 |
| Time to first fill (median) | 56 days business, 76 days technical | Job opened → first hire | Ashby, Q1 2026 |
Read the table from top to bottom and a pattern appears. The closer the clock starts to the candidate, the shorter the number: application-based figures cluster around 24 to 46 days, and job-based figures cluster around 39 to 76 days. The difference between the two is mostly the time a role spends open before its eventual hire even applies, plus the time spent on approvals before the job is posted. iCIMS's monthly figure sits at the fast end of the time-to-fill range, likely because its enterprise customer base hires heavily for frontline and high-volume roles, which close quickly - iCIMS.
So what counts as fast or slow? A useful rule of thumb is to compare your median with the median for your role family, and your 75th percentile with the published 75th percentile. Ashby's figures are the cleanest for this: 75% of business hires close within 46 days of application and 75% of technical hires within 57 days. If your median sits below the role-family median, speed is probably not your problem, and your attention belongs on quality and offer acceptance. If your 75th percentile sits well above the published one, you have a tail problem: a minority of requisitions is stalling, and the fix is usually in decisions and approvals rather than in sourcing.
Why this matters: most "our time to hire is too long" conversations compare an internal average from one definition with an external median from another, and the gap they are trying to close is partly imaginary. How to apply this: before quoting any benchmark, write down its start event, end event, statistic (median or average) and customer base, then compare your own number only with the row that matches all four. The next section explains each definition in detail, because choosing the wrong one is the most common benchmarking error in recruiting.
2. Time to Hire vs Time to Fill: Definitions That Change the Number
Time to hire and time to fill measure different parts of the same journey, and confusing them can make a healthy process look broken. Time to hire usually starts when a specific candidate enters your process and ends when that candidate accepts an offer, so it measures how fast you move a person. Time to fill usually starts when the job is opened or approved and ends when someone accepts, so it measures how fast you close a vacancy. SHRM defines time to fill precisely as the number of calendar days "from the time the job requisition was opened to the time the offer was accepted by the candidate", including weekends and holidays - SHRM.
Vendors then add their own variants, and each one changes the number. Ashby measures time to first fill, the days from a job opening to its first hire, because it considers ordinary time to fill an "imperfect metric": a search can be paused, restarted or rewritten, and evergreen roles have no single fill date. Employ starts time to hire at the candidate's "first interaction", which can come before a formal application. Gem starts when a candidate is entered into the ATS, which for outbound candidates is often well after the first message. None of these is wrong, but a figure from one cannot be compared with a figure from another without adjusting for the gap between their start events.
The diagram below lays out the full timeline of a typical hire and shows which span each metric covers. The labels on the right are the events most datasets use to start and stop their clocks.
The diagram makes one thing obvious: the stretch from job posted to eventual hire applies belongs to time to fill but not to time to hire. That stretch is the waiting room of recruiting, and it is the main reason time-to-fill figures run weeks longer than time-to-hire figures. Employ's average time to fill is 17 days longer than its average time to hire, and Ashby's median time to first fill for technical roles is 36 days longer than its median technical time to hire. It also explains why outbound sourcing behaves strangely in the metrics. In Gem's data, sourced candidates take a median of 41 days from entering the ATS to being hired, against 24 days for inbound applicants, because passive people need longer to decide. Yet sourcing can still shorten time to fill, because it moves the start of the winning candidate's journey earlier.
The statistic matters as much as the events. Time-to-hire data is right-skewed: most hires cluster in a band of a few weeks, while a long tail of difficult or stalled searches runs for months. Pinpoint's 2026 data shows this clearly for entry-level roles, where the median time to fill is 41 days but the slowest 10% take 107 days or more - Pinpoint. An average gets dragged toward that tail, which is why Gem's 2024 average of 41 days sits so far above its median of 24. When a vendor does not say which statistic it reports, assume the number could be either, and treat it as a range rather than a point.
Several smaller definitional choices also move the number. Three are worth checking before you compare anything:
- Calendar or business days, since SHRM uses calendar days and a five-day week shrinks every figure by about 30%
- First fill or every fill, because multi-hire requisitions fill their later seats much faster
- Accepted offer or start date, since notice periods add weeks in Europe
Two further choices deserve more emphasis because they hide failures: whether requisitions closed without a hire count at all (most vendors exclude them entirely), and whether internal moves are included. Greenhouse reports that only 69.8% of jobs at its North American customers closed with a hire in 2025 - Greenhouse. The other 30% never enter any time-to-fill calculation, so a team that cancels its hardest searches will report a better number than a team that persists with them. Internal transfers work in the opposite direction: they close in days, and a requisition mix with many internal moves will look fast for reasons that say nothing about external recruiting.
Why this matters: the definition you choose decides whether your process looks fast or slow before any candidate has done anything. How to apply this: track at least three clocks separately (requisition to posting, posting to first qualified applicant, and application to accepted offer), report each as a median with a 75th percentile, and keep a separate count of requisitions closed without a hire. With the definitions settled, the next question is how much the clock varies by the kind of job you are filling.
3. Time to Hire by Job Function
Job function is the single biggest driver of time to hire inside a company: technical and specialist roles take roughly twice as long as customer-facing and operational ones. Gem's 2026 benchmarks, built on 165 million applicants and 1.2 million hires between June 2021 and May 2025, put the median at 21 days for customer service and support and 22 days for operations, against 39 days for engineering, 42 days for data science and 43 days for design. Sales, often treated as a hard hire, closes in a median of just 26 days.
The chart below shows Gem's median days to hire for each department in its most recent period, June 2024 to May 2025. The ordering is consistent with every other dataset that splits by function: roles with clear, testable requirements and large candidate pools close fastest, and roles that need portfolios, multi-stage technical assessment or specialist judgment close slowest.
Median days to hire by department (Gem, June 2024 to May 2025)
Two results in the chart surprise most readers. Legal and compliance roles take a median of 41 days, almost as long as data science, and they have slowed by five days since 2021. These hires usually involve credential checks, small specialist candidate pools and senior sign-off, so the process has more gates even when the interview loop is short. IT and information security slowed the most of any function, adding 10 days since 2021 to reach a median of 35. Gem does not explain the change. One plausible factor, which the report does not test, is the growing number of identity and fraud checks that remote technical hiring now involves.
Ashby's data tells the same story from a different angle. Its hired technical candidates need a median of 40 days from application to hire, with the fastest quarter closing within 26 days and the slowest quarter taking 57 days or more. Business roles close in a median of 30 days, with a fastest quarter of 18 days and a 75th percentile of 46. Ashby's own summary of the data is stark: two weeks after application, business candidates are "twice as likely to have resulted in a hire" as technical ones.
Time to hire by role type, with the fastest and slowest quarters
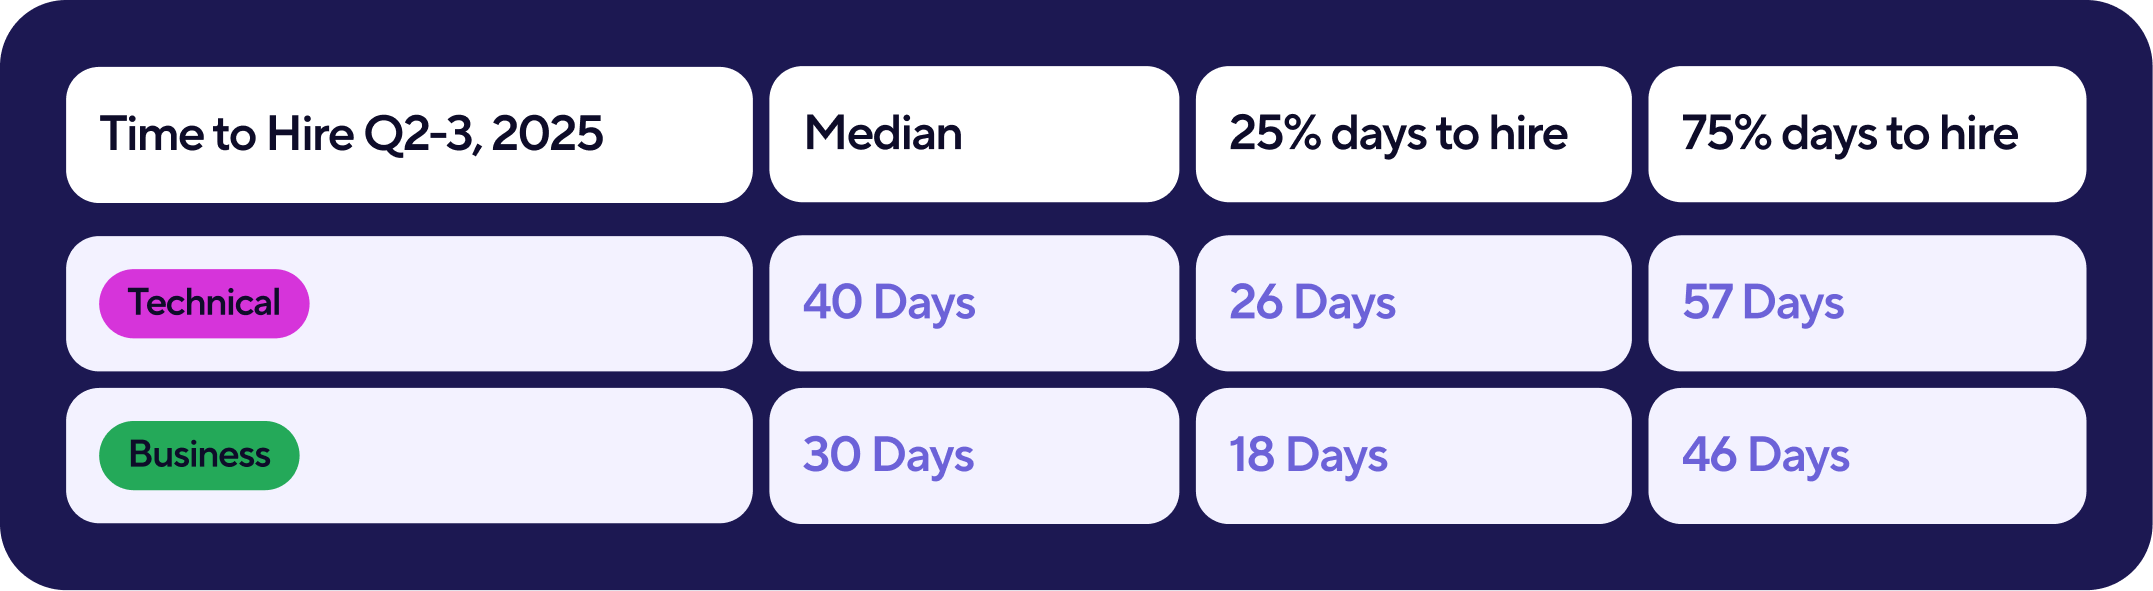
The table above is worth keeping next to your own dashboard, because the 25th and 75th percentiles tell you more than the medians. A technical search that has passed 57 days is already slower than three-quarters of comparable hires at Ashby customers, which makes it a candidate for intervention rather than patience. A business search still open after 46 days is in the same position. Most teams only look at the median and miss the moment a requisition crosses from normal into stalled.
The reason technical roles take longer is visible in the interview data. By the first quarter of 2026, a technical hire at an Ashby customer consumed 23.3 hours of total interview time across the hiring team, against 12.2 hours for a business hire - Ashby. Data roles topped the chart at 24.9 hours per hire, engineering followed at 24.7 and product management at 23.5, while customer support needed just 8.9 hours. Technical candidates also go through about five interview events against four for business candidates, and Ashby estimates that one extra round adds "roughly one week" to the process.
The late funnel adds more time. Gem finds that onsite-to-offer rates range from about 25% in technical roles to more than 40% in customer-facing ones, and that offer acceptance runs from 73% in engineering to 87% in sales. A technical search therefore needs more finalists and more offers per hire, and every extra finalist and declined offer adds days. Our recruiting funnel conversion benchmarks break down those stage rates in detail; for timing purposes, the takeaway is that slow technical funnels are narrow at both ends, not just at the top.
Why this matters: a single company-wide time-to-hire target will make engineering look slow and support look fast even when both are performing exactly at benchmark. How to apply this: set separate targets for at least three role families (customer-facing and operational, business and corporate, and technical and specialist), use the published medians and 75th percentiles above as your starting points, and review any requisition that crosses its family's 75th percentile. Function is only one axis, though, and seniority moves the clock almost as much.
4. Time to Hire by Seniority: Entry Level to Executive
Seniority adds time at every step, and senior roles take about a third longer to fill than junior ones. Ashby's median time to first fill rises from 52 days for junior roles to 63 days for mid-level and 71 days for senior roles, which makes senior searches 37% longer than junior ones in its January 2021 to March 2026 data - Ashby. The same report finds technical roles taking about 15 days longer to first fill than business roles, so a senior technical search combines both penalties.
Pinpoint, an applicant tracking system with a large UK and international customer base, publishes the most granular seniority data available, including percentiles. Its 2026 figures to date, built on more than 160,000 hires, measure from the day a job goes live to the day a candidate accepts. The chart below shows both the median and the 75th percentile for each level, because the gap between them is where planning goes wrong.
Time to fill by seniority, median vs 75th percentile (Pinpoint, 2026 to date)
The medians climb steadily from 41 days at entry level to 55 days for senior and executive roles, but the 75th percentile tells the more useful story. One in four management searches at Pinpoint customers takes 84 days or more, and even one in four entry-level searches takes 70 days or longer. Pinpoint's 2025 medians were slightly faster across most levels (38 days for entry level, 46 for middle management and 53 for senior management), so the 2026 figures to date suggest a small slowdown, though a partial year can still move. Executive medians are the noisiest series because the samples are small: Pinpoint's executive median was 72 days in 2023, 58 in 2024 and 56 in 2025.
Survey data points the same way but with a twist. SHRM's 2026 benchmarking survey found executive time to fill unchanged from 2025 at a median of 45 days, against 39 days for non-executive positions, and its 2025 brief noted that the executive median had fallen from 60 days in 2022 - SHRM. The 2025 brief offers a partial explanation for why executive fills can be fast: extra-large organizations filled a median of 50% of executive positions internally, and internal promotions skip most of the external recruiting clock.
External executive search is a different world. Clockwork Recruiting, whose software is used by retained search firms, analyzed more than 100,000 anonymized retained executive searches from 2020 to 2023 and found an average of 117 days from the start of a project to a successful placement - Clockwork. Board searches took the longest at 155 days, individual-contributor searches 95 days, and 76% of projects ended in a placement. The data predates 2025, but it is the largest published dataset on retained search, and it lines up with the three-to-four-month timelines search firms quote to clients.
Sourcing also shifts with seniority, which explains part of the slowdown. At Ashby customers, executive roles were filled through inbound applications only about 35% of the time, against roughly half of all hires, between January 2021 and June 2025 - Ashby. Senior people rarely apply to job ads, so a senior search depends on outreach, referrals and networks, all of which start slower and need more conversations before a candidate enters the process.
Early-career hiring sits at the other extreme of the curve but runs on its own calendar. NACE's 2025 Recruiting Benchmarks survey found an average of 27.3 days between a student's first interview and an offer or rejection - NACE. Campus offers are often made months before graduation, so time to start is long even when time to hire is short, and the competitive pressure is on the offer decision rather than the start date.
Why this matters: a hiring plan that assumes the company-wide median for a senior role will be wrong by a month in roughly half of cases, which is how leadership searches end up blamed on recruiters. How to apply this: plan senior and management searches against the 75th percentile rather than the median (around 84 days to acceptance in Pinpoint's data), add expected notice periods on top, and start outreach for any role above middle management before the requisition is formally approved. Seniority and function describe the job; industry describes the market around it, which is the next lens.
5. Time to Hire by Industry
Industry changes time to hire less than function or seniority, but it shapes the speed of high-volume hiring: hospitality and retail fill fastest, while software, financial services and manufacturing fill slowest. Employ's 2025 data shows the spread clearly. Its hospitality customers had the shortest time to hire at 40.4 days, software and technology customers took 51.9 days, and business services took the longest at 58.0 days. For time to fill, retail was fastest at 47.5 days, while software and technology (72.0 days) and manufacturing (72.6 days) were slowest.
Every vendor classifies by the employer's industry rather than by the role, and every vendor has a different customer base, so the same industry can look fast in one dataset and slow in another. A manufacturer's time to fill includes its engineers, accountants and maintenance technicians, not just production staff. The table below puts the most useful industry figures side by side. Read across a row for the range, and notice that the definitions differ by column.
| Employer industry | Employ, average time to fill (2025) | Gem, median time to hire (2025) | Pinpoint, median time to fill, entry level / middle management | iCIMS, time to fill (2026) |
|---|---|---|---|---|
| Technology / software | 72.0 days | 29 days | 40 / 47 days | not reported |
| Manufacturing | 72.6 days | 26 days | 39 / 43 days | 49-day benchmark |
| Financial services | not reported | 30 days | 44 / 49 days | not reported |
| Retail and consumer goods | 47.5 days (retail) | not reported | 29 / 36 days (consumer goods) | 37 days (retail, Sep 2026) |
| Health care | not reported | not reported | 39 / 52 days | not reported |
| Hospitality and transport | not reported | not reported | 40 / 47 days | not reported |
Manufacturing shows why you should never quote an industry number without its dataset. It is among the fastest industries in Gem's data, with a median of 26 days from application to hire, and among the slowest in Employ's, at an average of 72.6 days from posting to acceptance. The two figures measure different clocks, and Gem's customers skew toward technology-led companies, so its manufacturing segment probably looks quite different from Employ's. iCIMS sits in between: its manufacturing customers' benchmark is 49 days, and one customer cut its time to fill to 33 days - iCIMS. The same iCIMS report found manufacturing openings 29% above their July 2025 baseline while hires fell 6% below it, a sign that demand is outrunning hiring capacity in the sector.
Retail is the fastest large industry in every dataset that reports it. iCIMS measured retail time to fill at 37 days in September 2026, "remaining in the mid-30-day range throughout the year", while frontline application volume ended September 18% below its baseline and applicants per opening fell to 29, the lowest of the year - iCIMS. Fewer applicants per opening means each slow response costs more, because there is less of a queue to fall back on.
Financial services is consistently slow at the top of the funnel. Gem ranks it the slowest industry in its data at a median of 30 days, and Pinpoint's financial services customers take a median 44 days to fill even entry-level roles, the slowest of any industry at that level. Regulatory background checks, licensing requirements and conservative approval chains all add days that have nothing to do with candidate supply. Consumer goods sits at the opposite end, with Pinpoint's fastest entry-level median of 29 days.
Health care looks fast in general ATS data and slow in clinical data, and both are true. Pinpoint's health care customers fill entry-level roles in a median of 39 days, and for several seniority levels their median time from application to acceptance is under three weeks. Clinical roles that require licenses and credentialing run on a completely different clock, which the next section covers. When you benchmark a hospital, separate clinical from non-clinical roles before comparing anything.
Why this matters: industry benchmarks differ between vendors by more than industries differ from each other, so the wrong comparison group produces the wrong conclusion. How to apply this: pick the dataset whose customer base looks most like yours (Employ for small and mid-sized employers across sectors, iCIMS for large frontline employers, Gem and Ashby for technology-heavy companies), then compare within the same definition. For roles with licensing, credentialing or public-sector rules, ignore general industry figures entirely and use the specialist benchmarks below.
6. Specialist and High-Volume Roles: Nurses, Physicians, Hourly, Public Sector
The extremes of the market sit outside the corporate ATS datasets. Hourly restaurant hires close in under a week, registered nurses take about 11 weeks, federal jobs take two to three months, and physicians take four months or more. These roles share one feature: the clock is controlled less by the recruiting process than by structural factors such as licensing, credentialing, government rules or the sheer speed of an hourly labor market where candidates take the first offer.
Specialist benchmarks also come from specialist sources, and those sources use their own definitions. Hospital surveys report averages of self-reported ranges, physician recruiters report medians from search-tracking data, and the federal government publishes standards alongside actual averages that differ by tens of days. Each subsection below names its definition so you can compare it with your own data.
Registered Nurses
Experienced registered nurses take an average of 78 days to recruit, according to the NSI 2026 National Health Care Retention and RN Staffing Report, which surveyed 527 US hospitals about calendar year 2025 - NSI Nursing Solutions. That is five days faster than the previous year's 83, and it comes with a hospital RN vacancy rate of 8.6%. The figure is an average of ranges that hospitals select themselves, and NSI does not define precise start and end events, so treat it as a planning number rather than a precise benchmark.
Specialty and setting move the number a great deal. Across specialties the average ranged from 56 to 102 days: telemetry nurses were the hardest to recruit at 87 days, medical-surgical nurses took 83, and emergency nurses were the quickest of the major specialties at 70. Magnet-designated hospitals filled RN roles in 68 days, ten days faster than the national average, and the West region (70 days) was much faster than the North-Central region (82 days). Our guide to recruiting nurses in 2026 covers the sourcing plays behind the faster numbers, from licensure-compact targeting to new-graduate pipelines.
Physicians and Advanced Practice Providers
Physicians are the slowest common hire in any industry. The AAPPR 2026 benchmarking report, covering more than 10,000 physician and provider searches active in 2025, found a median of 119 days to fill a physician search, while advanced practice provider searches improved from 80 days in 2024 to a median of 65 days - AAPPR. Specialty extremes are dramatic: endocrinology and metabolism searches took a median of 321 days, and oncology 244 days.
Time to start is even longer than time to fill. The typical physician began work 229 days after the position was posted, because credentialing, privileging, licensing and onboarding all happen after the offer is accepted. And many searches never finish: 50% of physician searches were still open at the end of 2025, up from 47% in 2023. For health systems, the practical benchmark is not "how fast did we fill" but "how many months of patient access did the vacancy cost", which is why credentialing speed matters as much as recruiting speed. Our review of healthcare recruiting software covers the tools that shorten the credentialing stretch.
Hourly and Frontline Roles
Hourly hiring runs on days, not weeks. Fountain's 2025 quick-service restaurant snapshot, drawing on its 2024 Fast Food Report, puts the median time to hire at 6 days for restaurant team members and 8 days for managers, with top-performing teams hiring in 3 days against 13 days for the slowest - Fountain. These are vendor figures from a frontline-hiring platform's own customers, but they match what large employers report: in hourly markets, the first employer to make an offer usually wins.
That is why high-volume employers were the first to automate the whole early funnel. Workday, which completed its acquisition of conversational-AI hiring company Paradox on October 1, 2025 - Workday, publishes customer stories with large time savings. The short video below shows the best-known one: Chipotle, which reports cutting its time to hire from 12 days to 4 with an AI assistant that screens applicants and schedules interviews by text.
Chipotle Leverages an AI Platform to Reduce Time to Hire by 75%
The video is a vendor case study, so read the 75% as the best-case outcome rather than a typical one. The mechanism, however, is general: in hourly hiring most of the elapsed time is not evaluation but response lag (waiting for a manager to read an application, call back and find an interview slot), and anything that removes the lag removes most of the time to hire. The same logic helps explain why Employ's hospitality customers, with an average time to hire of 40.4 days, look so slow next to Fountain's 6 days: Employ's figure is an average across all hospitality roles, including salaried ones, and its clock starts at a candidate's first interaction rather than at the application. Our guide to volume recruiting with AI walks through how those funnels are built.
Staffing agencies work at similar speed for the same reason. Bullhorn's GRID 2026 report, based on a survey of about 2,300 recruitment professionals, found that 56% of the highest-growth firms report average placement times under 10 days - Bullhorn. That figure describes only the fastest-growing firms, and "placement time" is self-reported, but it shows the speed agencies sell to clients who cannot wait for an in-house search.
Federal and Public Sector Roles
Government hiring is the slowest large employer segment, and in 2026 it is also the most explicitly targeted. The US Office of Personnel Management's Merit Hiring Plan, announced in May 2025, committed to "decreasing time-to-hire to under 80 days" - OPM. A September 30, 2026 OPM memo turned that into an operating standard: 80 calendar days in total, split into 66 days from a validated hiring need to a tentative offer, 2 days to accept and 14 days to the first day on duty - OPM.
Actual performance has been slower than the standard for some occupations. OPM's public time-to-hire dashboard showed fiscal 2024 averages of 72.1 days for contracting, 75.5 days for human resources and 94.6 days for IT management, as cited in an August 2026 audit by the Government Accountability Office's inspector general - GAO OIG. State governments vary widely; New Mexico's State Personnel Office, for example, reported an average of 64 days from posting to offer acceptance in fiscal 2025 - New Mexico SPO. The public-sector lesson for private employers is that a published, stage-by-stage standard is a powerful tool in itself: OPM's 80 days is not a benchmark of what happens, but a budget that every stage must fit inside.
Why this matters: specialist roles can make an otherwise healthy recruiting function look slow in aggregate, and hourly roles can make a slow one look fast. How to apply this: report clinical, licensed, public-sector and hourly roles as separate segments with their own benchmarks (78 days for RNs, 119 for physicians, single-digit days for hourly), and for licensed roles track time to start alongside time to fill, because credentialing often takes longer than recruiting. Company size and location change the picture again, as the next section shows.
7. Time to Hire by Company Size and Region
Company size cuts both ways, and the direction depends on whether anyone owns recruiting. In technology-heavy datasets, the smallest companies are among the fastest: Gem's companies with 1 to 99 employees hire in a median of 20 days, against 29 days at companies with 500 to 999 employees and 22 days at those with 5,000 or more. In broad small-business datasets, the smallest employers are the slowest: Employ's small and medium businesses (up to 249 employees) averaged 56.4 days from first interaction to accepted offer in 2025, against 35.4 days at enterprises with 1,000 or more employees. Their time to fill showed the same gap, 83.5 days against 51.7.
The two datasets describe different kinds of small company. Gem describes its smallest customers as startups that "front-load their filters and decide quickly". Employ explains its small-business figure the other way round: those employers "often operate with leaner teams and fewer systems", with recruiters and hiring managers juggling several jobs at once. Ashby's startup data shows how much a dedicated owner matters: at startups with fewer than 25 employees, jobs with a recruiter involved took an average of 42 days to hire, against 62 days without one - Ashby.
The largest employers have their own drag. SHRM's 2025 data found that organizations with 5,000 or more employees took a median of 61 days to fill non-executive roles and 60 days for executive roles, well above the overall median, and spent nearly twice as long getting positions approved, getting jobs posted after approval and conducting interviews. SHRM's 2026 summary adds that extra-large organizations saw a 67% increase in median requisitions per recruiter - SHRM. Big companies are fast at the mechanics, as Employ's enterprise figures show, but slow at the approvals and coordination that surround them.
Ashby adds a useful observation about predictability. Smaller organizations show a very wide spread of time to first fill, with some searches closing far faster than at large companies and others dragging on for months, and the spread narrows as companies grow, beginning to stabilize at around 100 employees. The first gain from building a recruiting function is consistency rather than raw speed, and consistency is what makes headcount planning possible.
Region matters less than most people expect for time to hire, and more than they expect for time to start. Ashby's September 2026 EMEA report, covering more than 180,000 jobs in Europe, the Middle East and Africa, found a median time to hire of 35 days in EMEA against 34 days in the Americas over the past year, with both regions reaching their 75th percentile at about 50 days - Ashby. The EMEA average has stayed in a 37 to 43 day range every year since 2021, even as applications per hire doubled. Greenhouse's same-definition comparison shows a wider gap on time to fill: 62.2 days for its European customers in 2025 against 56.7 days in North America, with Europe up 40.2% since 2022 - Greenhouse.
Inside the US, location splits by market heat. Gem's employers in the San Francisco Bay Area and the New York metro both took a median of 29 days to hire, while employers in other US metros took just 18 days and international employers 22 days. The Bay Area and New York are where competition for the same technical candidates is fiercest and interview loops are longest, so speed there is harder to achieve, and also worth more.
Time to start is where Europe really differs. Ashby's report quotes its own recruiting lead: "In Europe, the common notice period for existing roles is often between one and three months", and in some cases the notice period only begins on the first day of the following month. Germany's civil code sets a statutory minimum of four weeks, ending on the 15th or the last day of a month - German Civil Code, and Ashby's recruiting lead cites German candidates with three-month notice periods against two weeks in Spain. A European offer accepted in mid-July can therefore produce a start date in October, and that gap is invisible in every time-to-hire benchmark in this guide.
Germany's official vacancy statistics show how severe structural shortages can get. The Federal Employment Agency measures how long a registered vacancy stays open after the employer's desired start date until it is withdrawn, which is a different clock from any recruiting metric. That figure averaged 126 days in 2019, reached a then-record 160 days in calendar 2024 and 169 days in the twelve months to September 2025, and stood at 156 days in the twelve months to September 2026, about 70 days more than a decade earlier - Bundesagentur für Arbeit. Nearly half of the vacancies withdrawn had been open for more than three months.
In the UK, the market is turning. The KPMG and REC Report on Jobs for October 2026 recorded permanent placements rising for a second consecutive month, at the strongest rate in four years, while vacancies declined at their weakest rate in just over two years - KPMG and REC. Measurement is catching up too: the CIPD's 2026 resourcing survey found that 31% of UK organizations now track time to hire, up from 21% in 2024 - CIPD. More than two-thirds still do not track how long their hiring takes.
Why this matters: size and region change both the benchmark and the bottleneck, so a startup, a 200-person scale-up and a 10,000-person enterprise should not chase the same number. How to apply this: compare yourself with companies of a similar size and recruiting setup (a startup with a recruiter should benchmark against Gem's and Ashby's small-company figures, a small business without one against Employ's), and for European hires plan the accepted-offer date and the start date separately. With the cross-section complete, the next question is the direction of travel.
8. Is Hiring Getting Faster or Slower? The 2021-2026 Trend
Hiring got slower from 2021 to 2024, and since then it has mostly held steady at the slower level. No major dataset shows a return to 2021 speeds, but none shows a continuing slide either. The cause of the slowdown is well documented: application volume roughly tripled, recruiting teams shrank, and companies added interview rounds to cope with weaker average applicant quality and more fraud. The bottleneck moved from finding candidates to filtering them.
The clearest long-run figures come from Greenhouse, which reports that time to fill at its North American customers rose 36.8% between 2022 and 2025, and at its European customers by 40.2%. Gem's 2025 report found average time to hire rising from 33 days in 2021 to 41 days in 2024, alongside a 42% increase in interviews per hire, from 14 to 20 - Gem. Its 2026 report shows the median moving much less, from 22 days to 24, which confirms that the slowdown was concentrated in the slow tail of hard searches rather than in typical hires.
Ashby's quarterly series shows when the slowdown stopped. Its median time to first fill for technical roles peaked at 81 days in the third quarter of 2022, settled around 70 days through 2023 and 2024, and stood at 76 days in the first quarter of 2026. Business roles have moved within a narrow band of about 51 to 64 days for five years. Ashby describes this as a "return to predictable hiring cycles", and its EMEA data tells the same story.
Time to first fill has stabilized since 2023
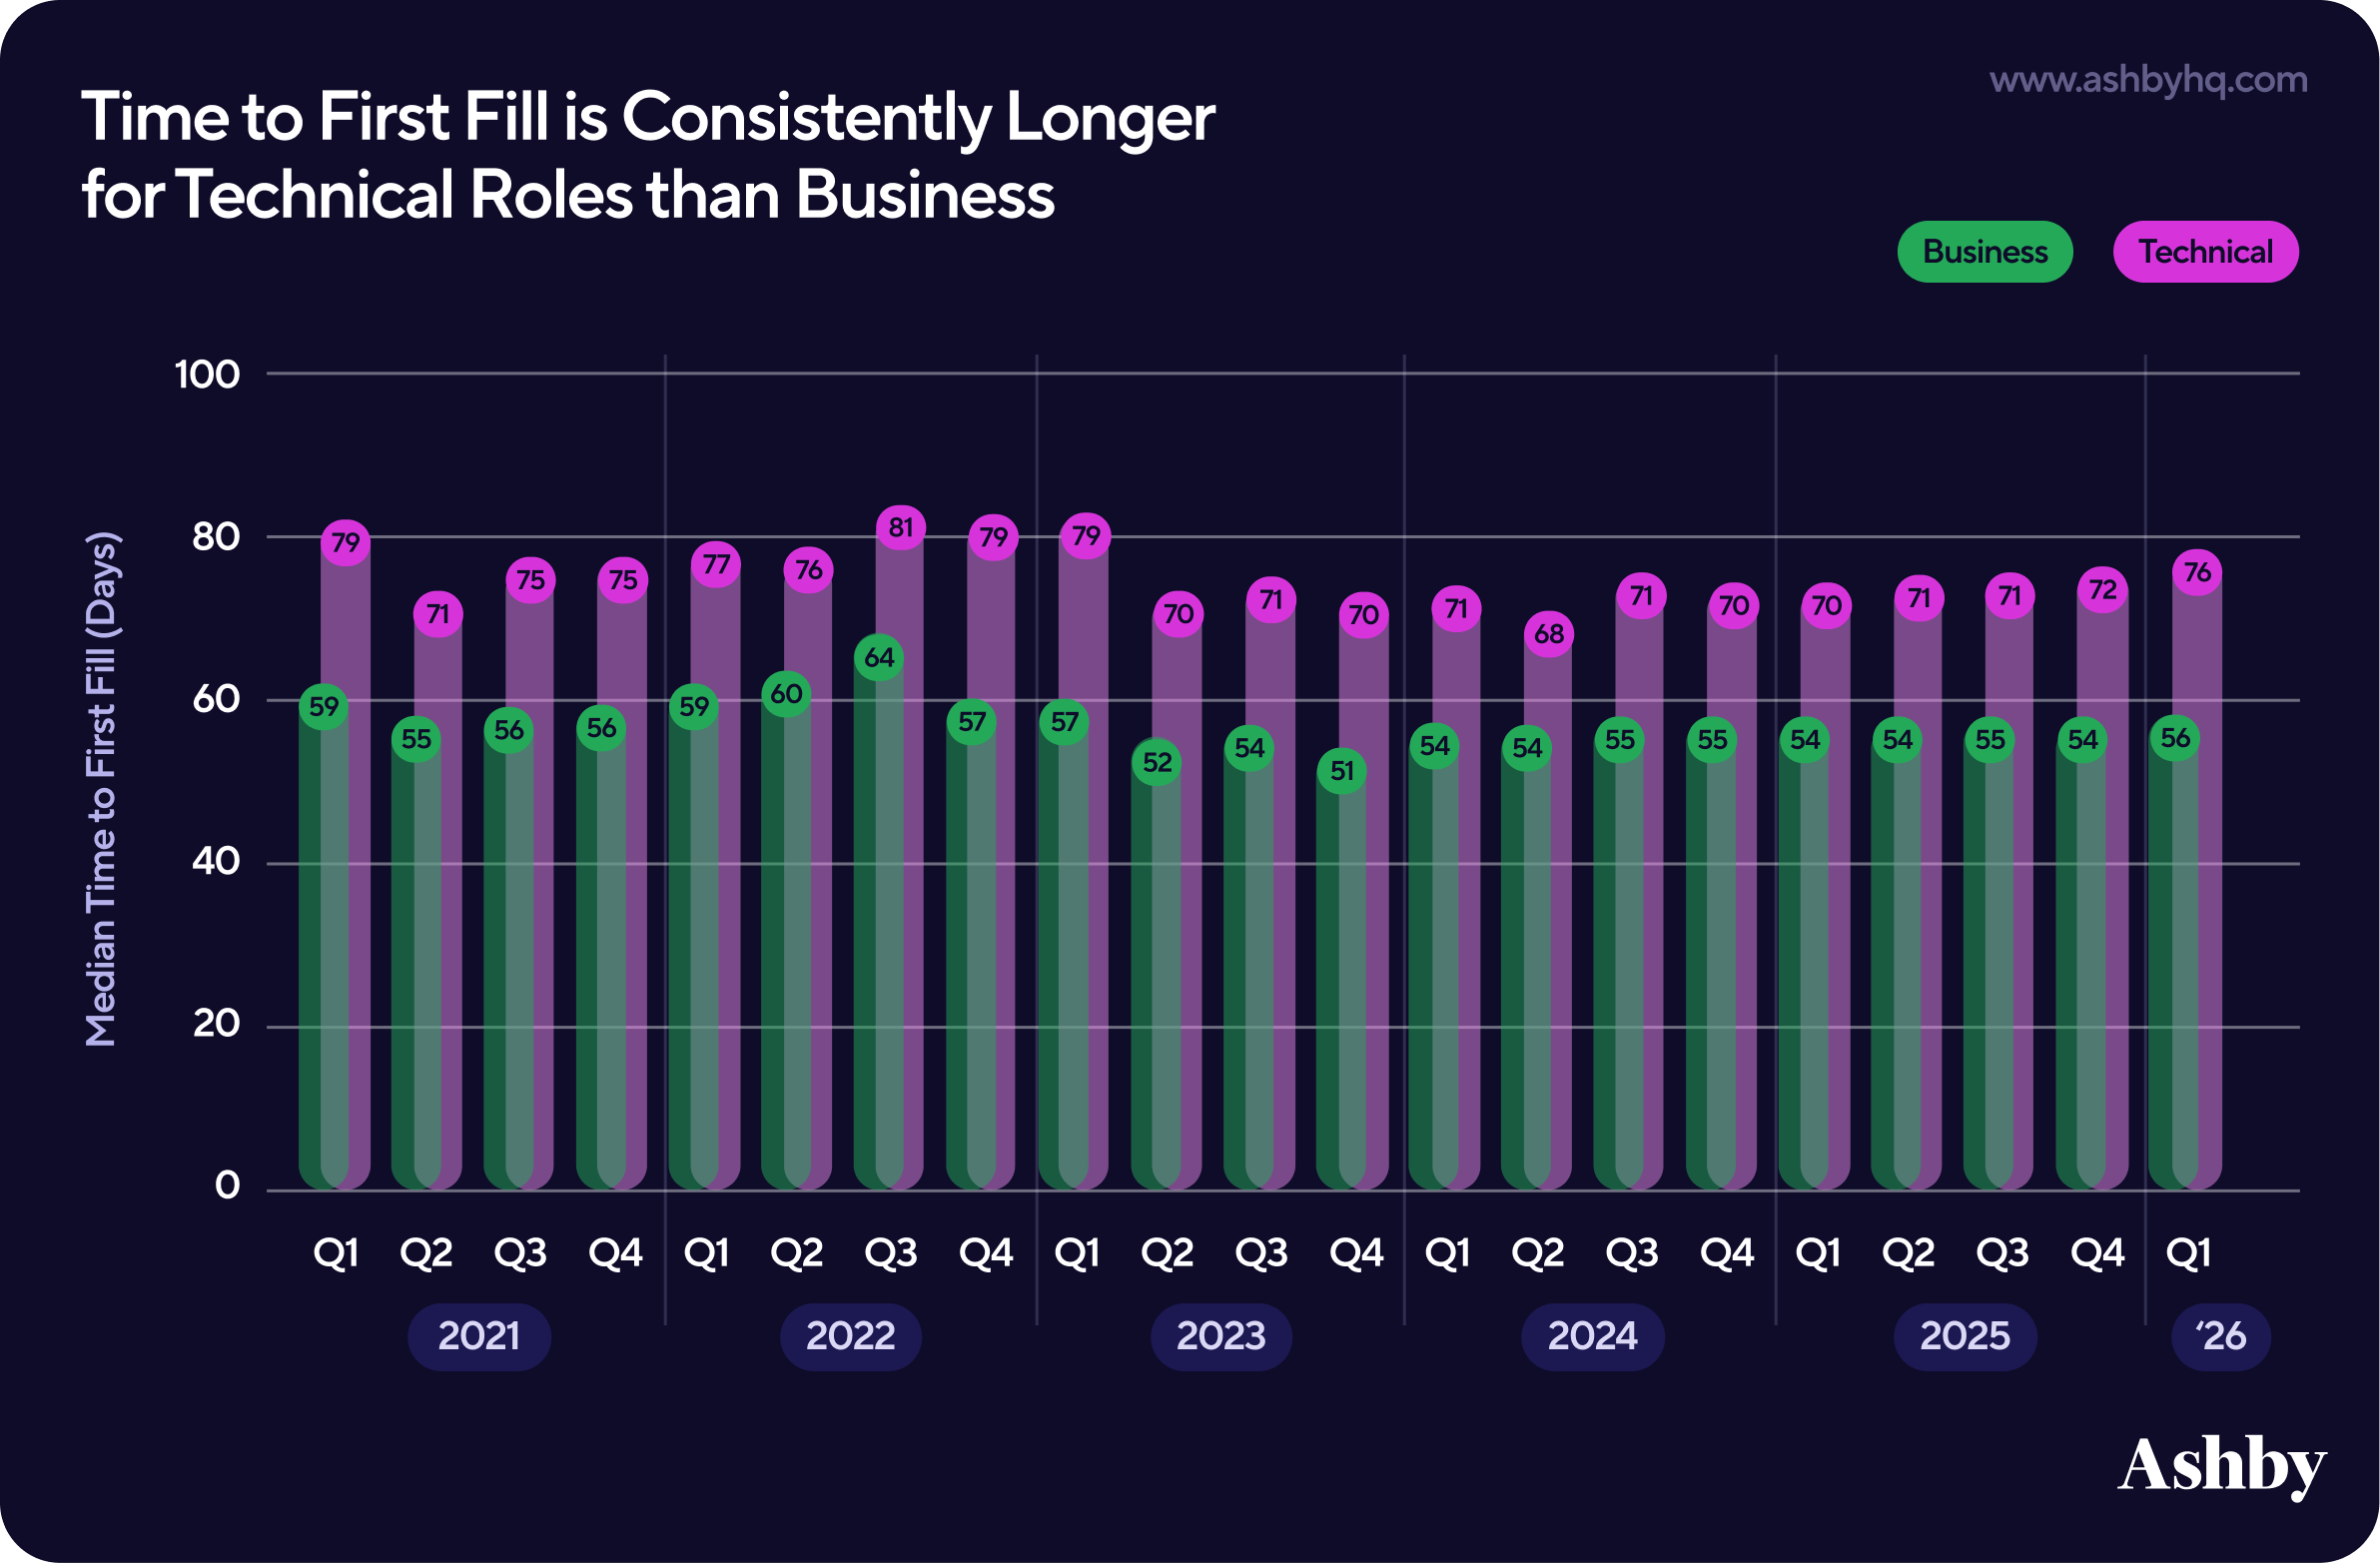
The chart also shows how persistent the gap between role types is. In every quarter since 2021, technical roles have taken 14 to 22 days longer to first fill than business roles, and neither line has trended down since 2023. Whatever efficiency gains recruiting teams have made, they have been absorbed by rising volume rather than turned into faster hiring.
The most recent datasets lean slightly faster. Employ's average time to fill fell from 67.7 days in 2024 to 63.5 days in 2025, and its time to first screen improved from 8.3 days to 7.2, although its time to hire edged up from 45.7 to 46.2 days. SHRM's median time to fill for non-executive roles fell from 44 days in 2025 to 39 days in 2026, even though more than two in three organizations still reported struggling to fill open positions. The two sources measure different things, but the direction is consistent.
The volume side of the story is better measured than the time side. Ashby's recruiters processed an average of 291 applications per hire in early 2026, against roughly 100 in early 2021, after a peak above 300 through 2025. Greenhouse reports that annual applications per recruiter rose 411.8% between 2022 and 2025, and LinkedIn says it sees about 11,000 job applications every minute - LinkedIn. Part of that growth comes from AI-assisted applying, which makes each application cheaper to send and harder to assess.
The labor market behind those numbers is unusually static. US hiring has moved in a narrow band for almost two years, with the hires rate between 3.1% and 3.5% of employment every month since January 2025 and the quits rate at or below 2% since July 2025. The chart below shows the Bureau of Labor Statistics' seasonally adjusted rates for hires, job openings and quits from January 2025 to August 2026, the latest month published.
US hires, job openings and quits rates (BLS JOLTS, seasonally adjusted)
The flat lines are the point. In August 2026 there were about 7.1 million job openings and 5.2 million hires, a hires rate of 3.3% and a quits rate of 1.9% - BLS JOLTS. Indeed's Hiring Lab described the market in mid-2026 as "stuck in still water", with hiring near the levels of 11 years ago even though the labor force is nearly 13 million people larger - Indeed Hiring Lab. Few people are changing jobs, so the people who are looking apply widely, and employers face large applicant pools of uneven quality rather than a shortage of applicants.
That combination explains why time to hire has not improved as much as the tools have. iCIMS found US job openings up 13% year over year in August 2026 against a 2% rise in hires, with applicants per opening falling to 30 - iCIMS. Demand is rising faster than hiring capacity in several sectors, and the constraint is increasingly the speed of decisions inside the process rather than the number of people knocking on the door.
Why this matters: comparing your 2026 time to hire with your own 2021 figures will show a slowdown that is mostly market-wide, not a failure of your team. How to apply this: benchmark against current-period data only, track your own trend quarterly against the stable Ashby and Employ series, and treat any improvement of five or more days as real progress in this market. The more actionable question is not whether hiring is slow, but where inside the process the days disappear.
9. Where the Days Actually Go: A Stage-by-Stage Time Budget
In a typical 30-to-40-day hire, the candidate spends only a few hours being assessed; almost all the remaining time is queueing. Ashby's hired candidates spend about 2.4 hours in interviews for business roles and 3.5 hours for technical roles before receiving an offer, and that figure has been flat since 2021. The rest of the month is spent waiting for someone to review an application, for a calendar slot, for feedback, for a decision and for an approved offer letter. That is good news, because queues respond to process changes in a way that candidate supply does not.
The published stage data lets you build a rough time budget for a typical hire. SHRM's 2025 benchmarking found that screening and interviewing alone average 8 to 9 days each within the posting-to-acceptance process - SHRM. Employ measured an average of 7.2 days from application to first screening interview in 2025, from 5.7 days at enterprises to 9.0 days in software and technology, and 3.6 days to schedule an interview once a candidate is advanced. Ashby's hired technical candidates take a median of 17.9 days from first to last interview, against 14.4 days for business roles.
| Stage | Typical duration | Source and period |
|---|---|---|
| Application to first screen | 7.2 days average (5.7 at enterprises, 9.0 in software) | Employ, 2025 |
| Decision to advance → interview scheduled | 3.6 days average | Employ, 2025 |
| Scheduling confirmation | 3.7 hours automated, 5 hours manual (median) | Ashby, 2021 to 2026 |
| First to last interview | 14.4 days business, 17.9 days technical (median) | Ashby, 2021 to 2026 |
| Screening; interviewing | 8 to 9 days for each stage (average) | SHRM, 2025 |
| Offer accepted → start | 1 to 3 months common in Europe; 229 days for physicians | Ashby EMEA, 2026; AAPPR, 2025 |
The most revealing data comes from comparing fast and slow companies. Ashby split its customers into the fastest and slowest quartiles by time to hire and measured where the extra days go. The answer is shown in the chart below: the slowest companies lose time at every stage, but the biggest gaps come after the final interview, in the decision and the offer.
Where slow companies lose time
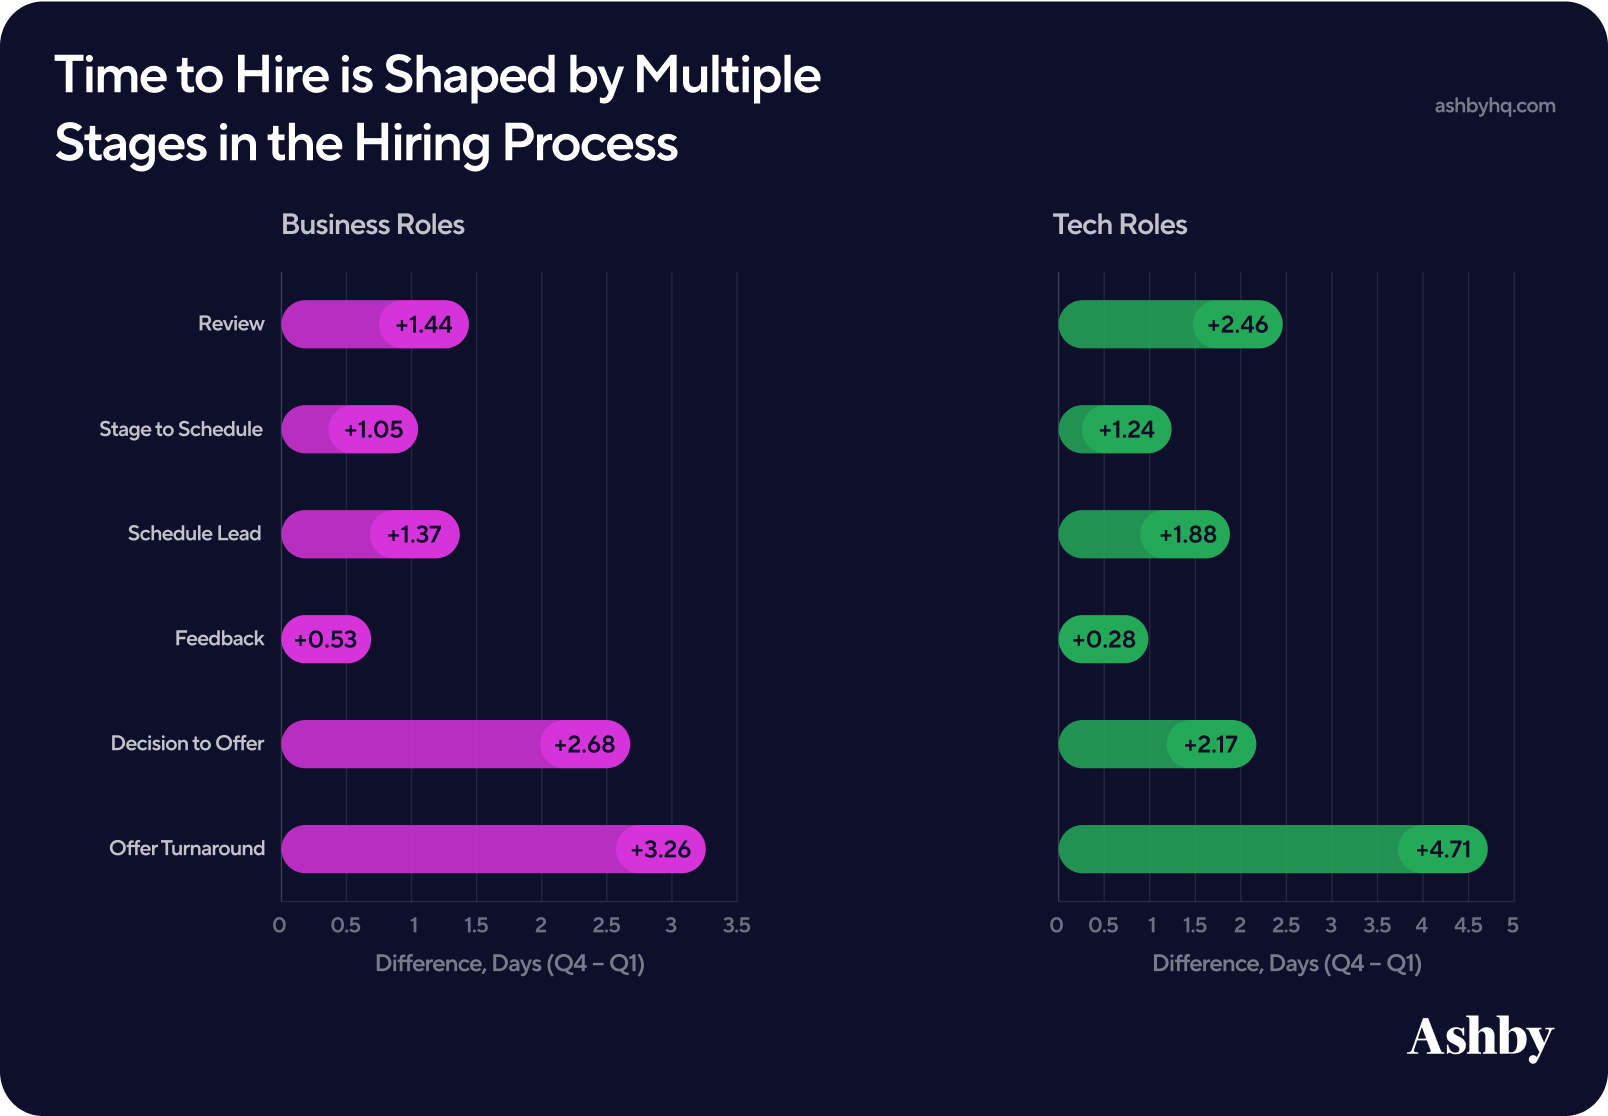
Add up the bars and the slowest quartile loses about 10 extra days on business hires and about 13 extra days on technical hires across these six steps. More than half of that gap sits in two late steps: decision to offer (2.68 extra days for business roles, 2.17 for technical) and offer turnaround, the time from entering the offer stage to an offer being created (3.26 and 4.71 extra days). Review and scheduling together account for most of the rest, while feedback submission barely differs between fast and slow companies. The lesson is uncomfortable for hiring managers: the slowest part of a slow process is usually the people who have already met the candidate and need to decide.
Ashby's text adds two further findings about the middle of the process. First, schedule lead time, the gap between a schedule being sent and the interview taking place, is a bigger bottleneck than the time it takes to send the schedule, because interviewer availability pushes interviews several days out. Second, the time between the final interview and a hiring decision is "one of the most significant sources of delay in the hiring process", and it is driven by incomplete or inconsistent feedback. Ashby found that 38% of pairs of interviewer scorecards differ by at least one point, and that disagreements crossing the yes/no line tend to add time.
The stretch after the offer is accepted is invisible to most dashboards and often longer than the recruiting itself. Background checks are usually fast now: Checkr says 89% of its criminal checks, including county searches, complete within an hour, although that is the vendor's own figure - Checkr. Notice periods, credentialing and relocation are not. For physicians, AAPPR's 229-day posting-to-start figure is nearly double the 119-day time to fill, and for European hires a one-to-three-month notice period routinely doubles the time from requisition to first day.
Why this matters: if you only measure the total, you will invest in sourcing when the days are actually lost in scheduling and decision-making. How to apply this: export stage timestamps from your applicant tracking system, compute the median days spent in each stage for hired candidates, and compare the pattern with the table above. The stage where your median most exceeds the benchmark is your first fix. Before getting to fixes, it is worth being precise about what the lost days actually cost.
10. What Slow Hiring Really Costs
The biggest cost of slow hiring is the candidates you lose without noticing, not the empty seat. Withdrawals, competing offers and candidates who simply stop replying rarely show up as a recorded outcome in an applicant tracking system, so the cost of slowness is under-reported by design. Criteria's 2024 Candidate Experience Report found that more than one third of candidates have walked away from a recruitment process because it was taking too long, and 34% assume they have been ghosted after just one week without contact - Criteria.
Silence makes it worse. In Greenhouse's 2026 Candidate AI Interview Report, a survey of 2,950 job seekers whose headline findings reflect its 1,200 US respondents, 51% of those who completed an AI interview never heard back afterwards - Greenhouse. Ashby's data shows the reputational effect: candidates who were not interviewed gave a median Net Promoter Score of 9 when they were archived within a day, 7 when archived after 10 to 24 days, and just 3 when left for 50 days or more. Ashby notes this is a correlation, since faster-archiving companies may be better in other ways too, but the pattern is steep.
Speed also changes how candidates feel about the companies that do hire them. In the 2025 Candidate Experience benchmark, which covered more than 66,000 candidates at over 110 employers, 60% of candidate respondents said their offer letter arrived less than a week after their last interview, and offers made within a week more than doubled candidates' willingness to refer others, a 108% increase - Survale. A fast offer does more than win the candidate; it turns them into a source of the next one.
The pool you lose candidates from is getting smaller in many sectors. iCIMS put it bluntly in September 2026: "With only 30 candidates per role, every breakdown in your process is costing you real hires." That matters most in frontline and healthcare markets, where applicants accept the first credible offer. For registered nurses, the cost of a vacancy is unusually measurable: NSI's 2026 report puts the average hourly rate for a travel nurse at $91.23 against $59.46 for a staff RN including benefits, a gap of about $66,000 a year for every vacancy covered by agency staff - NSI Nursing Solutions.
Outside healthcare, be skeptical of "cost of vacancy" benchmarks. The widely quoted per-day figures circulating on recruiting blogs rarely trace back to a published method, and none of the major benchmark reports in this guide calculates one. A better approach is to estimate your own using the role's planned contribution. If a role is expected to produce $200,000 a year of revenue or output, each working day of vacancy defers roughly $800 of it (at 250 working days a year), less the salary you are not yet paying. That is illustrative arithmetic rather than a benchmark, but it gives finance and hiring managers a number they recognize and can challenge.
Slow hiring also consumes recruiter capacity. Greenhouse's North American recruiters averaged 4.9 hires per month in 2025 while managing far more applications than in 2022, and every requisition that stays open for an extra month occupies a share of that capacity that could have closed another role. When a team says it is too busy to speed up, it is often too busy because it is slow.
Why this matters: the cost of slowness falls on the best candidates first, because they have the most alternatives, so a slow process quietly lowers the quality of the people you end up hiring. How to apply this: add a "withdrawn" or "lost to competing offer" disposition to your ATS and make recruiters use it, survey candidates on speed, and translate the vacancy cost into your own revenue terms for hiring managers. With the cost made visible, the fixes in the next section become much easier to justify.
11. Fixes That Measurably Cut Time to Hire
The fixes with the strongest evidence attack the queues around decisions, offers and scheduling, not the supply of candidates. That ordering follows directly from the stage data in section 9: the biggest gaps between fast and slow companies sit after the final interview, scheduling lead time is the largest controllable delay in the middle, and review time is the first delay at the top. Sourcing matters too, but it shortens time to fill rather than time to hire, so it belongs later in the list.
Each fix below names the evidence behind it and how strong that evidence is. Some rest on large ATS datasets, some on vendor case studies, and a few on simple arithmetic about where the days go. None of them requires a new platform to start, although several are much easier with one, and the first two alone address more than half of the gap Ashby measured between fast and slow companies.
Fix 1: Put a Clock on Decisions and Offers
The single largest source of extra days at slow companies is the stretch from final interview to written offer. Ashby's slowest quartile spends an extra 2.68 days (business) and 2.17 days (technical) getting from a decision to an offer, plus an extra 3.26 and 4.71 days in offer turnaround, the time from entering the offer stage to an offer being created. Ashby's recommended remedies are standardized offer templates with built-in controls and automated approvals, so that a decision does not wait on a chain of finance, people-team and leadership sign-offs.
In practice, three habits close most of this gap. Schedule the hiring debrief at the same time as the final interview, so the decision meeting exists before the candidate walks in. Agree the compensation band and approval route when the requisition is opened, so an in-band offer needs no fresh approval. And set a service level for the offer itself, such as a written offer within one business day of the decision. These are design choices rather than tools, which is why the fastest companies achieve them on ordinary software. The payoff is not only speed: as section 10 showed, offers made within a week of the last interview more than doubled candidates' willingness to refer others.
Fix 2: Automate Scheduling and Widen the Interviewer Pool
Scheduling is the most automatable delay in hiring and the one with the clearest measured gain. Ashby's customers confirmed interviews in a median of 3.7 hours with automated scheduling against 5 hours manually, 26% faster, and the gain compounds across every round of a loop. Employ's enterprises took 3.1 days to get an advanced candidate into an interview against 3.8 to 3.9 days at smaller companies, a gap Employ attributes to automation and dedicated scheduling support.
The bigger lever is schedule lead time, the days between sending a schedule and the interview actually happening, which Ashby identifies as the larger bottleneck. Automation cannot create interviewer availability, so the fix is structural: train more interviewers per stage, use interviewer pools rather than named individuals, and protect recurring interview blocks in calendars. Moss, an Ashby customer quoted in its EMEA report, holds its time to hire at 35 to 36 days partly through automated reminders: candidates get "three chances through reminders to book a time" before being archived, which stops aging candidates from clogging the pipeline.
High-volume employers have pushed scheduling automation furthest. In the short case study below, Singtel describes scheduling interviews in nine seconds with Workday Paradox, which it says saved 5,000 administrative hours and cut its time to hire by 75%.
Scheduling Interviews in 9 Seconds with Workday Paradox
Treat the 75% as a best case from a vendor-produced story, but notice the mechanism it shows: the candidate picks a slot the moment they qualify, so the days lost to email back-and-forth simply disappear. Our comparison of automated interview scheduling apps covers options for teams that are not on an enterprise suite.
Fix 3: Cut Interview Rounds, Not Interview Quality
Every extra interview round costs about a week. Ashby estimates that the additional round technical candidates face "adds roughly one week to an already longer hiring process", and Gem's 2025 report found that the 42% rise in interviews per hire between 2021 and 2024 came with a 24% rise in average time to hire. The cheapest way to save a week is therefore to remove a round that does not change decisions.
Moss offers a practical model: it consolidated its stages so that "even if a role technically has seven interviews instead of five, we group them into fewer formal rounds", running several conversations on the same day. Two further habits shorten decisions without removing evaluation. Use take-home assignments sparingly (Ashby finds only about 13% of hires include one) and only where they replace an interview rather than add to one. And make feedback fast and complete: Ashby found that interviewers using its AI notetaker submitted about 6% more scorecards within 24 hours (70% against 66%), and complete scorecards are what allow a quick decision. Our guide to AI interview meeting tools compares the notetakers.
Fix 4: Review Applications Within Days, Not Weeks
The review stage is the first queue every candidate meets, and it is where slow companies start falling behind. Employ's customers took an average of 7.2 days to move an applicant to a first screening interview in 2025, from 5.7 days at enterprises to 9.0 days in software and technology. Ashby's slowest quartile spends an extra 1.44 days in review for business roles and 2.46 days for technical roles, and the gap is largest where application volume is highest.
The fix has two parts. First, define the screening criteria before the job is posted, including knock-out questions for genuine requirements such as work authorization, licenses or location, so that reviewers apply a rule rather than form an impression. Second, use AI-assisted review where volume makes manual review impossible, with the criteria written down and a human making the final call; most modern applicant tracking systems now include this. Archive the candidates you will not progress quickly as well, since Ashby's NPS data shows how much goodwill a fast "no" preserves compared with silence.
Fix 5: Put a Recruiter on the Role Early
Ownership is a speed lever that small companies often skip. Ashby's startup data shows the effect most clearly: at companies with fewer than 25 employees, jobs with a recruiter involved closed in an average of 42 days, against 62 days without one.
Recruiter involvement shortens time to hire at small startups
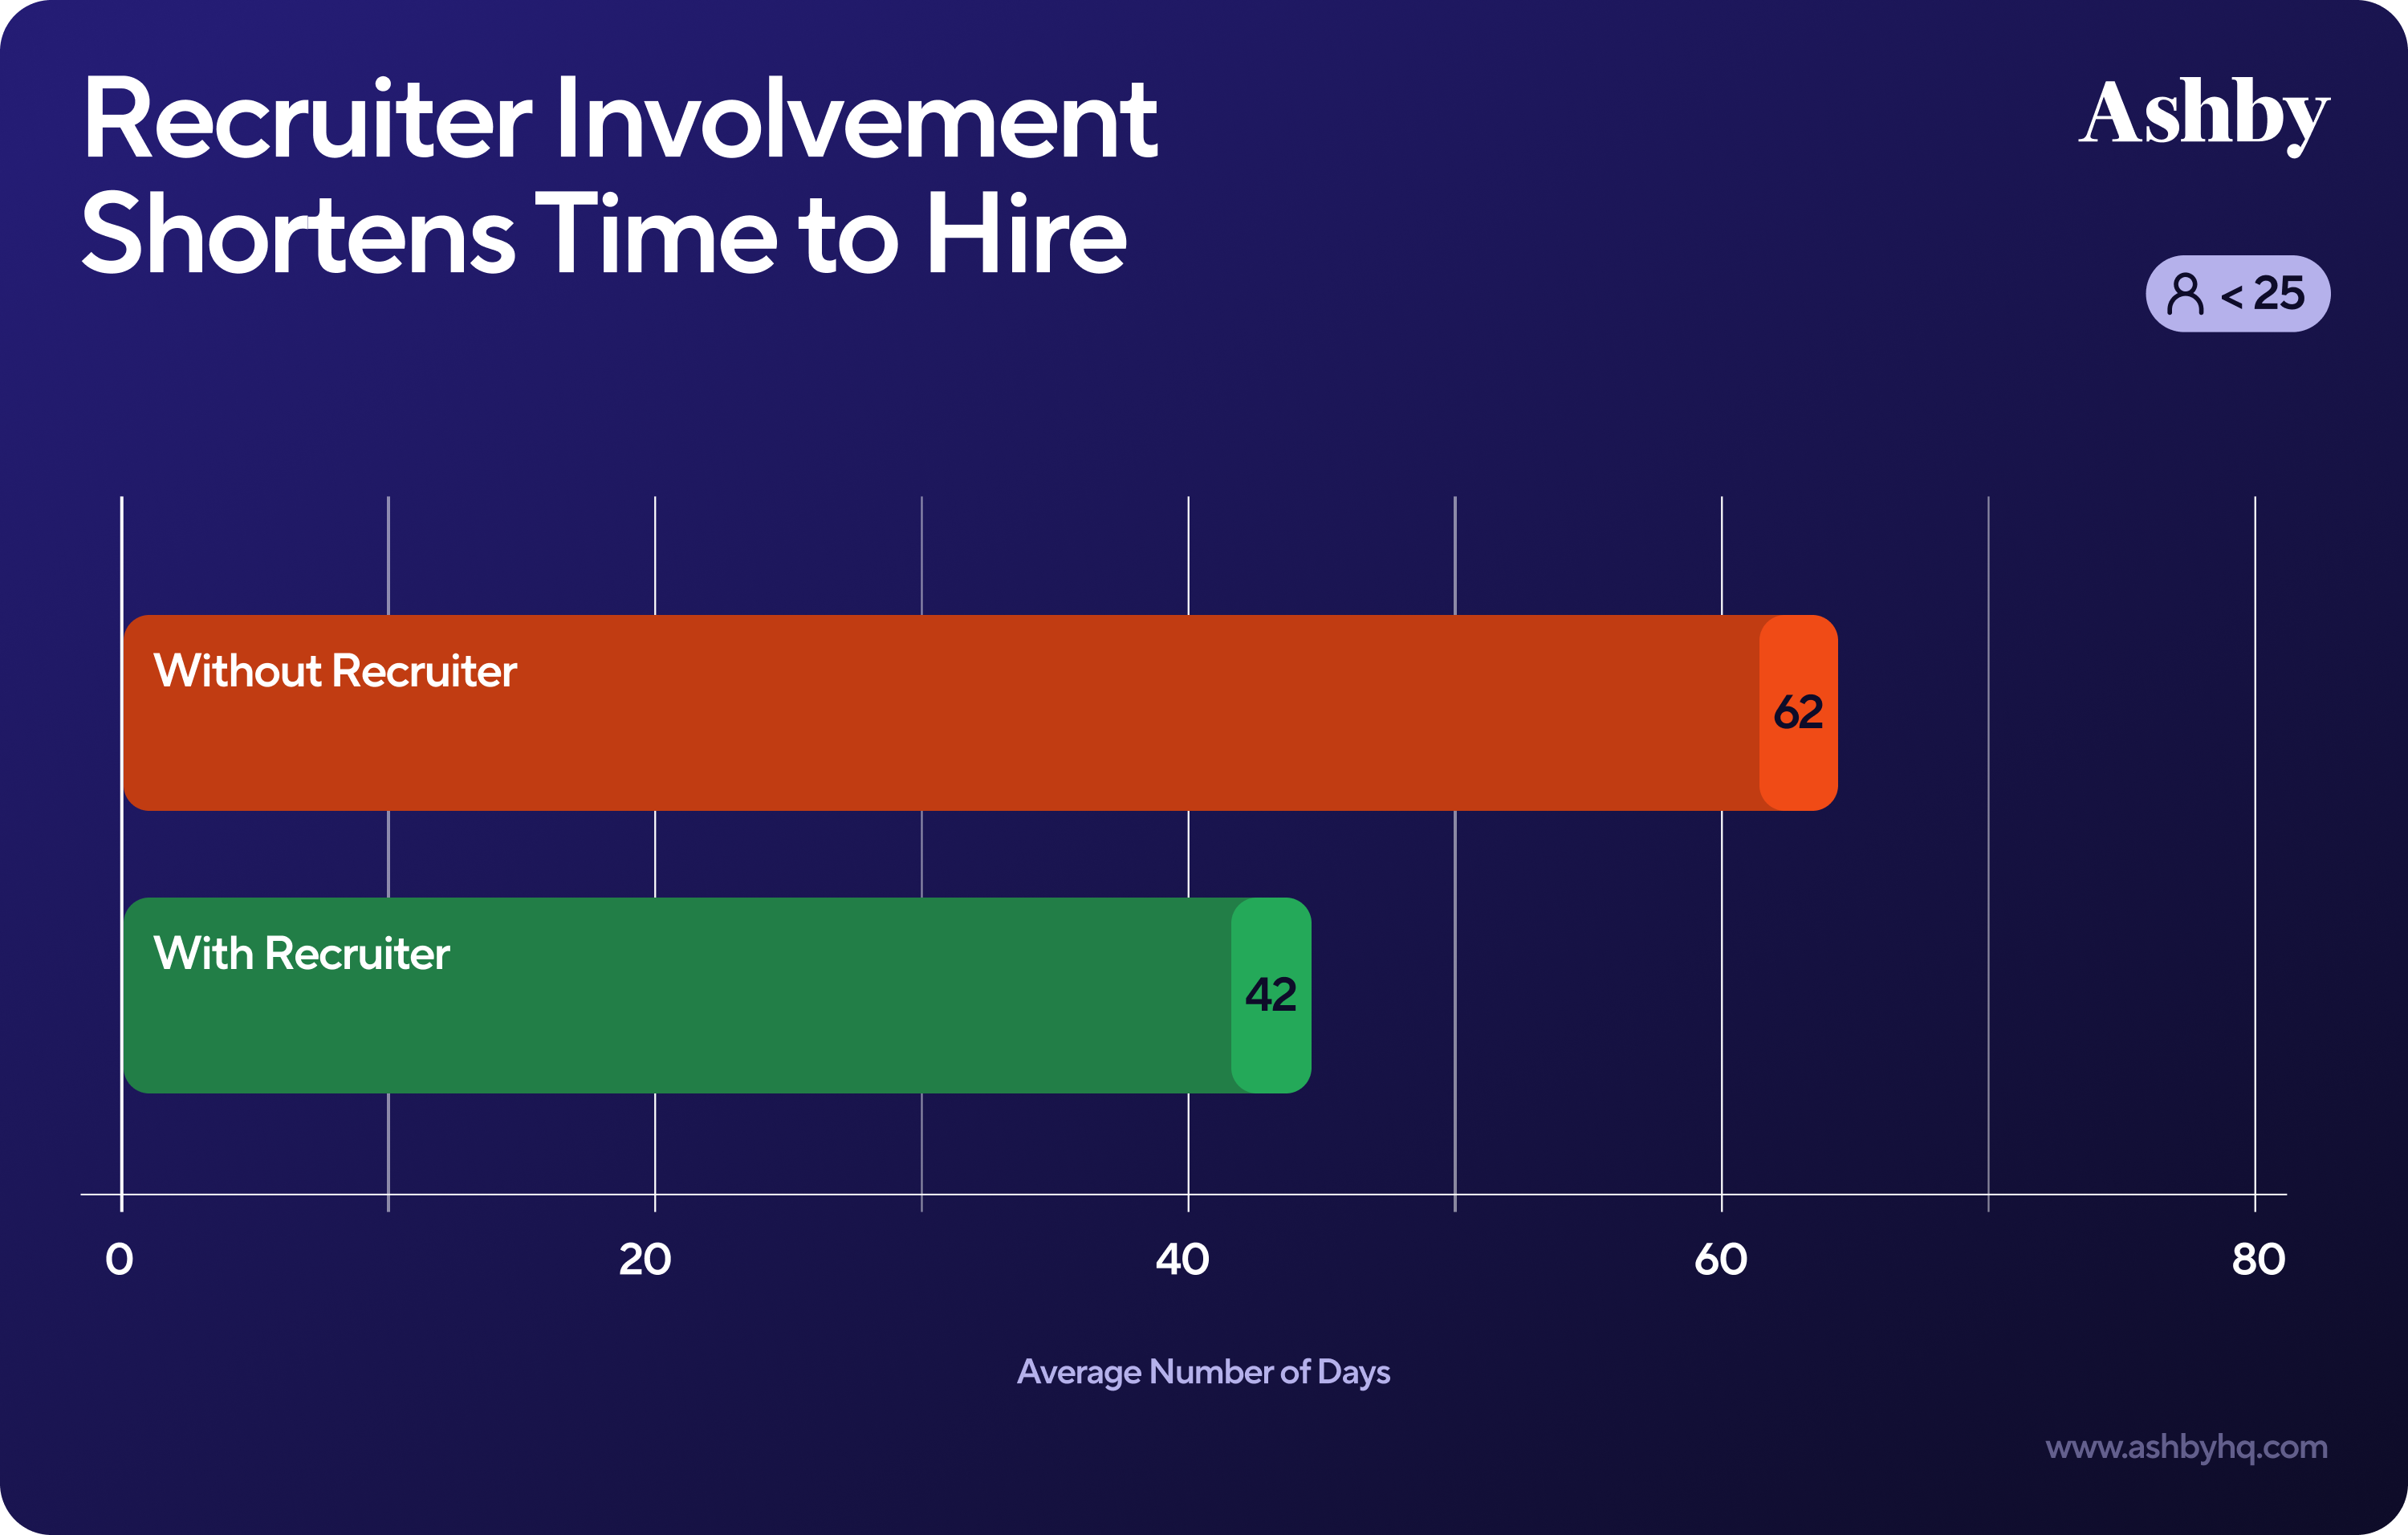
The 20-day gap in the chart is larger than any tool-based improvement in this guide, and the reason is simple: someone owns the clock. A recruiter chases feedback, books the debrief, and pushes the offer through, while a founder hiring alone fits those tasks around everything else. Larger startups show a smaller gap, which Ashby attributes to the processes their talent teams have already built, so the lesson generalizes: every requisition needs a named owner who is measured on its timeline, from approval to acceptance.
Fix 6: Start the Search Before the Requisition Opens
The longest stretch of a typical vacancy is the wait before the eventual hire even enters the process, and only pipeline work shortens it. Ashby's technical roles take a median 76 days to first fill but only 40 days from application to hire, which means a large share of an open technical role's life passes before the winning candidate applies. Three sources can put candidates in front of you earlier: your own database, your employees' networks and outbound sourcing.
Rediscovery is the most underused. 46% of sourced hires at Gem customers now come from candidates already in the company's CRM or ATS, up from 26% in 2021 - Gem. Referrals are the highest-signal source: at Ashby customers, 52% of referred candidates pass initial screens against 35% overall, and referred hires score slightly higher on Ashby's quality-of-hire surveys (4.0 against 3.8 for inbound and 3.9 for sourced hires). Outbound sourcing converts best of all once candidates are in the process: Gem finds 2.5% of sourced candidates hired against 0.3% of inbound applicants.
HeroHunt.ai
The slowest part of most vacancies is the wait before the right person applies: Ashby's technical roles take a median of 76 days to first fill but only 40 days from application to hire. HeroHunt.ai works on exactly that stretch. Its AI Recruiter searches more than 1 billion profiles, screens each one against your written brief with language models and runs personalized outreach on autopilot, so a shortlist of interested candidates can exist before the job ad has drawn its first strong applicant. Pricing is published: an 8-day free trial (card required), then plans from $99 a month with unlimited positions. The honest caveat: sourcing shortens time to fill, not time to hire. Gem's sourced candidates take a median of 41 days from entering the ATS to hire, against 24 for inbound applicants, because passive people decide more slowly, and no sourcing tool fixes a slow decision or offer stage (fixes 1 and 2 above).
The caveat in that box applies to every sourcing approach, human or automated. Outbound candidates need more conversations, are more likely to hold a counteroffer, and take longer to decide, so sourcing should start early enough that its slower per-candidate clock still finishes first. The practical pattern is to begin sourcing and rediscovery when a requisition is forecast rather than when it is approved, so that the candidate pool is warm by the time the job is posted. Our recruiting outreach benchmarks show how many messages it takes to produce one interested candidate.
Fix 7: Run the Post-Offer Steps in Parallel
The clock that matters to the business stops on the first day of work, not at the accepted offer. For most roles, background checks are now quick enough to run the moment an offer is accepted rather than as a separate gate. For licensed roles, credentialing and licensing should start as soon as a finalist is identified, since the typical physician in AAPPR's data started work 229 days after posting, against a 119-day median time to fill. For European hires, the notice period is fixed, so the controllable risk is losing the candidate during it.
Ashby's recruiting lead makes the point about notice periods directly: "keeping engagement through that gap becomes just as important as closing the offer". Regular contact from the hiring manager, early access to onboarding materials and a first-week plan all reduce the chance of a late counteroffer winning. Our guide to beating counteroffers covers the tactics for the most contested candidates.
Why this matters: most teams try to fix time to hire by sourcing harder, while the largest measured gaps sit in decisions, offers and scheduling, which cost nothing to fix except discipline. How to apply this: work through the fixes in order, starting with a decision and offer service level, then scheduling and interview rounds, then review speed, then ownership, and only then pipeline building. Tools can accelerate almost every one of these steps, and the next section looks at how AI is changing each of them.
12. How AI and AI Agents Are Changing Time to Hire
AI is shortening the administrative stages of hiring (screening, scheduling, first-round interviews and sourcing), but most of the published evidence is vendor case studies, and the best independent survey shows a minority of employers getting faster. The CIPD's 2026 survey asked UK organizations using AI in recruitment what had changed as a result: 32% said time to hire had decreased, 42% said it had stayed the same, and 17% said it had increased. The CIPD suggests part of the increase reflects the time it takes to embed AI into recruitment processes in the first place.
The gap between vendor stories and survey results is not a contradiction. AI removes queues where work is repetitive and rule-based, such as answering applicant questions, booking interviews and running structured first-round screens. It does little for the queues that depend on people, such as debriefs, approvals and offer negotiations, which section 9 showed are where slow companies lose the most time. A company that automates scheduling but keeps a week-long decision process will report "no change", and it will be right.
The table below sorts the main categories of AI tools by the stage they shorten, with published prices where vendors list them. Prices were read on vendors' pricing pages in October 2026, and evidence marked as a vendor claim has not been independently audited.
| Category | Stage it shortens | Examples | Published price (Oct 2026) | Evidence on speed |
|---|---|---|---|---|
| Conversational AI for hourly hiring | Application, screening, scheduling | Workday Paradox, Fountain | No public list price | Vendor case studies: Chipotle 12 to 4 days, ISS 65 to under 10 days |
| AI interviewers | First-round screening interview | Ribbon, Classet, HireVue, Sapia.ai | Ribbon from $499/month (billed annually, 100 interviews); Classet from $249/month (billed annually, 50 interviews) | Vendor claims; candidate pushback documented by Greenhouse |
| AI sourcing agents | Finding and contacting candidates before they apply | LinkedIn Hiring Assistant, HeroHunt.ai, Juicebox | LinkedIn: negotiated add-on to a Recruiter contract; HeroHunt.ai from $99/month; Juicebox from $99/seat/month | LinkedIn: 4+ hours saved per role (vendor) |
| AI inside the applicant tracking system | Review, scheduling, notes and feedback | Ashby, Greenhouse, Workday, SAP SmartRecruiters | Bundled with the ATS | Ashby: automated scheduling 26% faster; 6% more scorecards within 24 hours |
Conversational AI has the strongest track record because hourly hiring is mostly queues. Workday's customer stories report ISS North America cutting time to hire by 85%, from 65 days to under 10 - Workday, and Sodexo cutting its average time to hire by 60%. These are vendor-authored stories from its best customers, but the scale of the change is consistent with the mechanism: when a candidate can apply, answer screening questions and book an interview in one text conversation at midnight, days of manual follow-up vanish. The consolidation of the market reflects the bet: Workday completed its acquisition of Paradox on October 1, 2025, and SAP completed its acquisition of SmartRecruiters in September 2025 - SAP.
AI interviewers compress the first-round screen from days of scheduling into an interview the candidate can take immediately, which is why vendors such as Ribbon and Classet publish per-interview pricing. The risk is candidate experience. Greenhouse's May 2026 survey found that 63% of job seekers have now faced an AI interview, that 70% were never clearly told upfront that AI would evaluate them, and that 38% have walked away from a hiring process because it included an AI interview. An AI screen that loses a third of candidates is not faster in any sense that matters. Our guide to AI candidate interviewers compares the leading vendors. Our analysis of why candidates quit AI interviews covers how to deploy them without that loss.
AI sourcing agents work on the waiting room before the application. LinkedIn's Hiring Assistant became globally available in English in September 2025, when LinkedIn reported early adopters "saving 4+ hours per role" and reviewing 62% fewer profiles - LinkedIn. Those are hours of recruiter effort rather than days of elapsed time, which is the right unit for sourcing tools. LinkedIn announced Hiring Assistant 2 on September 29, 2026, adding memory of how each recruiter hires, receptiveness signals, voice pre-screening and the ability to evaluate candidates already in your ATS, rolling out from November 2026 at no extra cost to existing customers. The official overview below shows what changes.
What is LinkedIn Hiring Assistant 2? Features and Benefits Explained
The video shows the direction of the whole category: agents that hold context about a role and a recruiter's preferences, and that move a candidate from search to screened shortlist without a human touching each step. The limits are just as important. Hiring Assistant only recommends LinkedIn members and people already in your ATS, and it requires an enterprise Recruiter contract plus a negotiated add-on; our Hiring Assistant 2 guide covers the costs in detail. Alternatives such as HeroHunt.ai, which searches the open web and runs outreach by email, and Juicebox, which offers self-serve seats, trade LinkedIn's engagement signals for wider reach or lower entry prices. Our ranking of autonomous AI recruiters compares the agents side by side.
AI inside the applicant tracking system is the least glamorous category and the most broadly used. Ashby's data shows automated scheduling confirming interviews 26% faster, AI notetakers lifting scorecard completion within a day, and AI-assisted application review helping teams triage the 291 applications they now receive per hire. These gains are small at each step, but they are measured on very large datasets rather than on showcase customers, which makes them the most reliable numbers in this section.
Why this matters: AI can remove most of the waiting that is caused by administration, but it cannot remove waiting caused by people who have not decided, and it can add delay when it loses candidates or requires new verification steps. How to apply this: deploy AI against the specific stage your time budget shows is slowest, measure that stage before and after, disclose AI use to candidates, and judge every tool by days removed from your median rather than by the percentages in its case studies. Speed is not free, though, and the next section covers when chasing it goes wrong.
13. When Faster Hiring Backfires: Limits and Failure Modes
Speed is a means, not a goal, and there is no solid 2025-2026 evidence that faster hiring produces better or worse hires on its own. Ashby's Quality of Hire report, built on more than 35,000 manager scorecards for nearly 15,000 hires, measures how new hires perform but does not test whether speed predicts it - Ashby. The report quotes Laura Barnes, VP of Recruiting at Flock, on the risk of the metric: time-to-fill targets make recruiters "feel that they need to fill a role in 60 days or their job is on the line", when the real question is whether they found the best person.
Greenhouse makes a similar case from its own data. Its 2026 benchmark report argues that the 37% rise in time to fill since 2022 "indicates intentionality", and quotes HR technology analyst Tim Sackett: "Some companies want a longer time-to-fill because they want to do their due diligence and ensure they're hiring the right talent." That framing is partly self-serving for a market that got slower, but the underlying point stands: a time-to-hire target that ignores quality invites exactly the wrong optimizations.
The most common failure modes are predictable, and most of them make the dashboard look better while making hiring worse. Teams under pressure close hard requisitions instead of filling them, which removes those searches from time-to-fill calculations. They lower the bar late in a search to hit a date. They use exploding offers that pressure candidates and depress acceptance. They skip verification for remote roles, which invites fraud. And they automate rejection so aggressively that strong candidates are filtered out before a human sees them.
Each of these has a measurable signature if you look for it. Closed-without-hire requisitions show up in the share of jobs filled, which was only 69.8% at Greenhouse's North American customers in 2025. A lowered bar shows up in early attrition and quality-of-hire scores, which is why Employ advises teams with short times to "check in post-hire (30, 60, 90 days)" because "if turnover is on the rise, speed may be coming at the expense of quality". In quick-service restaurants, where hiring takes days, Fountain's snapshot cites Black Box Intelligence data showing 43% of hires leave within 90 days, a reminder that the fastest funnels can also be the leakiest.
Fraud deserves special attention because it pushes in the opposite direction from speed. Since Greenhouse's identity verification product became generally available in February 2026, it has run more than 10.2 million checks and flagged one in four candidates for review, with about one in 33 failing identity verification outright - PR Newswire. Verification adds a step, but a fraudulent hire costs far more than a day. Our guide to detecting AI interview cheating covers where those checks fit without slowing genuine candidates.
Why this matters: a team rewarded only for speed will eventually trade quality, candidate trust or security for days, and the cost of that trade arrives months later. How to apply this: always report time to hire alongside at least one quality measure (90-day retention or a hiring-manager rating at 30 to 90 days), track the share of requisitions closed without a hire, and treat any speed gain that coincides with rising early attrition as a warning rather than a win. With those guardrails in place, you can safely set about cutting your own number.
14. How to Benchmark and Cut Your Own Time to Hire in 30 Days
You can benchmark your time to hire properly and remove the worst bottleneck within a month, using only your applicant tracking system's data and a spreadsheet. The method follows the logic of this guide: measure the right clocks, compare them with the right benchmark, find the stage where the days go, and fix that stage first. Most teams that try this discover that their problem is narrower than they thought, which makes it far easier to fix.
The plan below assumes a recruiting team with at least a few dozen hires in the past year, enough for medians to mean something. Smaller teams can follow the same steps with a longer look-back period or pooled role families. The four steps map to four weeks, but they can run faster if your stage data is clean.
- Week 1: measure three clocks. Export every hire from the last 12 months with timestamps for requisition opened, job posted, application, each stage change, offer and acceptance. Compute the median and 75th percentile of time to hire and time to fill for each role family.
- Week 2: pick the benchmark. Choose the dataset whose customers and definitions match yours from sections 1 to 7, and mark each role family as below median, between median and 75th percentile, or above.
- Week 3: build the budget. For hired candidates, compute the median days spent in each stage, compare it with the stage table in section 9, and use the diagnostic below to find the first fix.
- Week 4: fix one stage. Change the single slowest stage, publish service levels for every stage, and start reporting weekly on requisitions that cross their 75th percentile.
The order matters because benchmarking without stage data produces blame rather than fixes. A time-to-hire figure tells you that you are slow; only the stage budget tells you where.
If your applicant tracking system does not record clean stage timestamps, fix that before anything else. The most common gaps are candidates moved through several stages at once at the end of a search, offers created outside the system, and requisitions opened in a finance tool rather than the ATS. A month of disciplined data entry, with recruiters moving candidates on the day each event happens, is usually enough to produce a usable first time budget.
The diagnostic below turns the stage data into a decision: start at the top and follow the branch that matches your biggest gap against benchmark.
The diagram deliberately puts final interview to offer first among the stage branches, because it is where Ashby's slow companies lose the most time and because the fix costs nothing but agreement between the hiring manager and the recruiter. The posting to first qualified applicant branch comes last, not because it is unimportant, but because it is the only one that needs investment in sourcing capacity or tools before it pays back.
A worked example shows how the numbers come together. Take a hypothetical 300-person software company whose engineering hires take a median of 52 days from application to accepted offer, with a 75th percentile of 80 days. Against Ashby's technical benchmark (median 40, 75th percentile 57), the company is 12 days slow at the median and much slower in the tail.
Its stage export shows candidates waiting a median of nine days between final interview and written offer. That is the first fix: a debrief within one business day of the last interview and pre-approved bands for in-band offers. If the company closed only the gap Ashby measured between its slowest and fastest quartiles on those two steps (about 6.9 days for technical roles), its median would fall to around 45 days, most of the way to benchmark without hiring anyone new. The figures here are illustrative, but the arithmetic is the same for any team.
Service levels make the gains stick. Reasonable starting points, based on the stage data in this guide rather than on any single published standard, are a first review within three business days of application, interviews scheduled within two business days of a candidate advancing, a debrief within one business day of the final interview, and a written offer within one business day of the decision. OPM's 80-day federal budget shows the same idea at government scale: once each stage has a budget, delays become visible the day they happen rather than at the end of the quarter. For a quick estimate of how many candidates each stage needs to feed your plan, our free candidates-per-hire calculator runs the funnel math by role and industry.
Why this matters: teams that benchmark without stage data argue about whether they are slow; teams with stage data fix the slowest step and move on. How to apply this: run the four steps above once, keep the stage report running monthly, and repeat the diagnostic each quarter, because the bottleneck moves once you fix it. The final question is where all of this is heading.
15. Future Outlook: Time to Hire in 2027 and Beyond
The administrative part of time to hire is heading toward zero for structured roles, and the remaining time will be human decision time. Agents are moving from assisting recruiters to running whole stages: LinkedIn's Hiring Assistant 2 rolls out from November 2026 with memory, receptiveness signals and voice pre-screening, Workday is building Paradox's conversational hiring into its suite, and SAP is doing the same with SmartRecruiters. For hourly and other high-volume roles, leading employers already report interviews booked within minutes of an application, and that will become the norm.
For professional and technical roles, the bottleneck will shift rather than disappear. As sourcing, screening and scheduling speed up, the stages that remain slow will be the ones that need human judgment: interviews, debriefs, approvals and offer negotiations. Ashby's data already shows that the gap between fast and slow companies is mostly in those late stages, and AI does not close it on its own. The employers that pull ahead will be the ones that redesign decisions (fewer rounds, faster debriefs, pre-approved offers), not just the ones that buy agents.
Three further forces will shape the numbers. First, verification will add steps: identity checks, fraud screening and AI-use disclosure are becoming standard in remote hiring, and Greenhouse found 57% of candidates believe disclosure of AI evaluation should be a legal requirement. Second, measurement will move toward quality: in the second quarter of 2026, 25% of Ashby's enterprise customers were already running quality-of-hire surveys, and time-to-hire targets without a quality counterpart will look increasingly dated. Third, labor-market churn will decide how much speed is worth. With quits at about 1.9% and hiring flat, employers can afford slower processes; if quits rise, candidates will hold more offers and speed will again decide who hires them.
Our view, which is a forecast rather than a finding, is that the gap between fast and slow employers will widen through 2027. Median time to hire for structured hourly roles will settle in single-digit days at well-run employers, while technical roles will stay in the 30-to-40-day range because their interview loops are hard to compress without losing signal. The biggest gains will go to teams that combine agents for the administrative stages with disciplined human decisions, and the benchmark that matters most will increasingly be the 75th percentile rather than the median, because stalled searches, not typical ones, are where hiring loses its best candidates.
Why this matters: investment decisions made in 2026 will set your time to hire for years, and money spent automating stages that are not your bottleneck will not move the number. How to apply this: use your stage budget to decide where agents belong, pair every automation with a decision-speed service level, and add a quality measure to every time metric you report. The conclusion below pulls the guide into a single decision framework.
Conclusion: A Decision Framework for Time to Hire
The honest answer to "what is the average time to hire in 2026" is about a month from application to accepted offer and six to nine weeks from opening the job, with technical, senior, licensed and public-sector roles running far longer and hourly roles far shorter. Almost every difference between published figures comes from definitions and customer bases rather than from the market, so the most valuable thing you can do with any benchmark is check its start event, end event, statistic and population before you compare.
Use your own data to place yourself in one of five situations, and act accordingly. If your median and 75th percentile are both at or below your role family's benchmark, stop chasing speed and protect quality and offer acceptance. If your median is fine but your 75th percentile is high, you have a tail problem: review every requisition that crosses the 75th percentile and look for stalled approvals and decisions. If your median is above benchmark, build the stage budget and fix the stages in the order of section 11: decisions and offers, then scheduling and rounds, then review. If your time to hire is fine but your time to fill is long, your problem is pipeline, and the answer is rediscovery, referrals and sourcing that starts before the requisition opens. And if your roles are licensed or specialist, measure time to start alongside time to fill, because credentialing and notice periods will dominate both.
For teams whose diagnosis lands on the pipeline branch, where interviews and offers move quickly but too few strong candidates enter early enough, the answer is to start the search sooner. That can mean rediscovering candidates already in your ATS, building referral habits, or using AI sourcing tools that search and contact candidates at scale; HeroHunt.ai is one such option, alongside the others compared in section 12.
Fix the decision and offer stages first, then shorten the wait before the right candidate applies: HeroHunt.ai's AI Recruiter searches 1B+ profiles, screens candidates against your brief and runs personalized outreach on autopilot.
This guide reflects time-to-hire benchmarks and tools available as of October 2026. Benchmark datasets are revised between editions, vendors define their clocks differently, and published prices and product features change frequently, so verify the methodology, period and pricing behind any number (including these) before holding your team to it.